Figure 5.
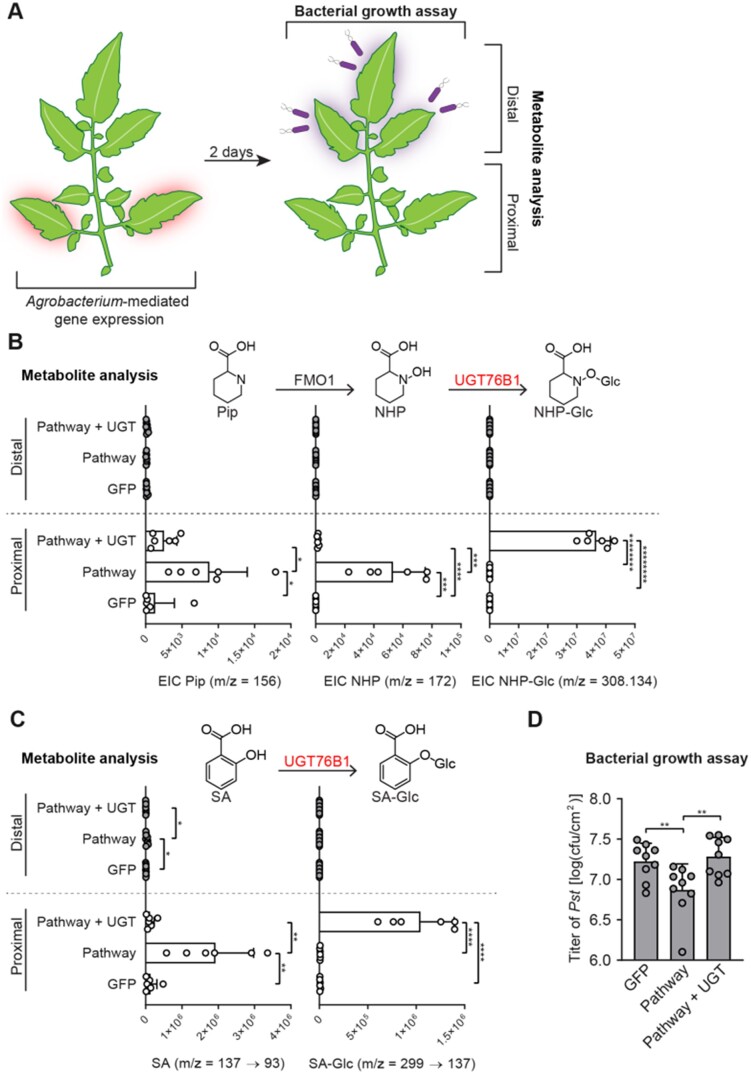
Transient expression of Arabidopsis UGT76B1 with ALD1 and FMO1 in tomato leaves. A, Design of the transient SAR assays in tomato. Two leaflets of a tomato leaf proximal to the main stem (highlighted in red) were inoculated with Agrobacteria harboring GFP (GFP) or a combination of strains harboring GFP + Arabidopsis ALD1 + Arabidopsis FMO1 (Pathway) without and with Arabidopsis UGT76B1 (Pathway + UGT). For the bacterial growth assay in (B): 2 dpi with Agrobacteria, distal leaflets (highlighted in purple) were inoculated with a 1 × 10⁵ cfu/mL suspension of Pst. Four dpi, distal leaves were harvested for quantification of Pst titers. For metabolite analysis in (C) and (D): 2 dpi with Agrobacteria, both proximal leaflets infiltrated with Agrobacteria and distal, untreated leaflets were harvested independently for analysis. B, Abundances of Pip, NHP, and NHP-Glc in tomato leaflets expressing GFP, Pathway, and Pathway + UGT (white bars) and leaflets distal to those infiltrated with Agrobacteria (gray bars). Bars for proximal leaflets represent means ± sd (two leaflets each from n = 3 independent plants). Bars for distal leaflets represent means ± sd (three leaflets each from n = 3 independent plants). Pip and NHP were measured as TMS and 2-TMS derivatives, respectively, using GC–MS. NHP-Glc was measured using LC–MS. Values reported as zero indicate no detection of metabolites. Asterisks indicate a significant difference in metabolite levels (one-tailed t test; *P < 0.05, ***P < 0.001, ****P < 0.0001, *******P < 1 × 10⁻⁶, ********P < 1 × 10⁻⁷). The experiment was repeated two times with similar results. C, Abundances of SA and SA-Glc in tomato leaflets expressing GFP, Pathway, and Pathway + UGT (white bars) and leaflets distal to those infiltrated with Agrobacteria (gray bars). Bars for proximal leaflets represent means ± sd (two leaflets each from n = 3 independent plants). Bars for distal leaflets represent means ± sd (three leaflets each from n = 3 independent plants). SA and SA-Glc were measured using LC–MS. Values reported as zero indicate no detection of metabolites. Asterisks indicate a significant metabolite difference in metabolite levels (one-tailed t test; **P < 0.01, ****P < 0.0001). The experiment was repeated two times with similar results. D, Titer of Pst in distal leaflets 4 dpi. Bars represent mean log cfu/cm2 ± sd (three leaflets each from n = 3 independent plants). Asterisks indicate a significant difference (one-tailed t test; **P < 0.01).

