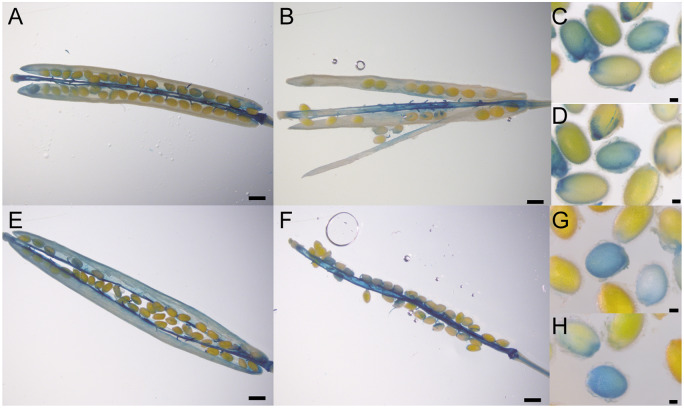
Figure 10.
Expression pattern of AtLAC5. GUS staining of transgenic plants harboring the 4,140-bp (A–D) or 2,000-bp (E–H) promoter region of AtLAC5 fused to GUS. Siliques at 7 (B), 8 (F), 9 (A and E) days after flowering and immature seeds at 10 days after flowering (C, D, G, and H) were used for the analyses. Scale bars=0.64 mm (A, B, E, and F) or 0.1 mm (C, D, G, and H).

