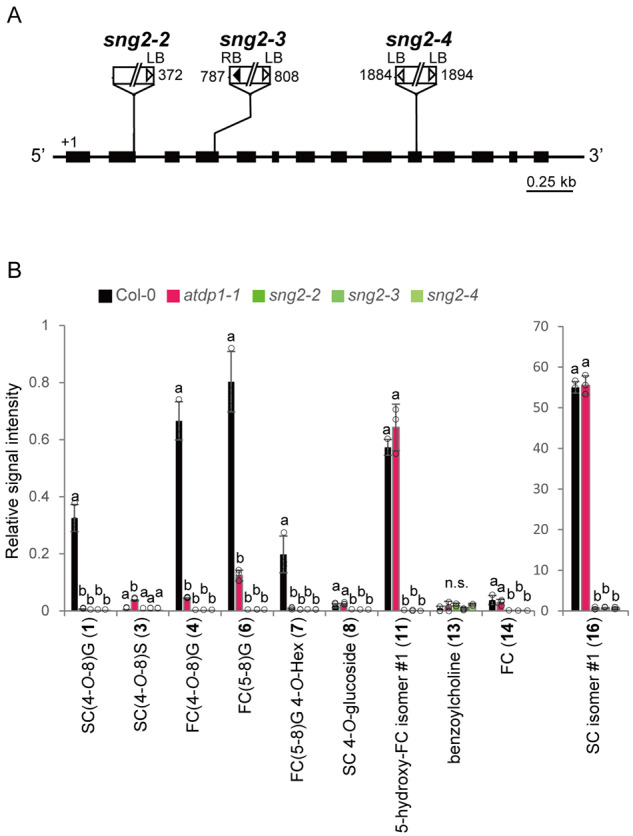
Figure 12.

T-DNA insertion mutants of SCT, sng2. (A) Schematic representation of SCT showing the three T-DNA insertion mutants used in this study. The thick line indicates the coding region and the thinner line indicates the 5′- and 3′-untranslated regions. White and black triangles show the left and right borders, respectively. Numbers indicate the position of the T-DNA insertion. LB, left border; RB, right border. (B) UPLC–QTOF–MS analyses of neolignans and choline derivatives in the mutants. The structures of compounds (1, 3, 4, 6–8, 11, 13, 14, 16) are shown in Figure 1. Data represent the means ± sd (three biological replicates per sample). The means were compared by a one-way ANOVA. Statistically significant differences (P < 0.05) were identified by Tukey’s test and are indicated by lowercase letters to represent differences between groups. G, Guaiacyl moiety; S, Syringyl moiety; SC, sinapoylcholine; FC, feruloylcholine; Hex, hexose; n.s., not significant.
