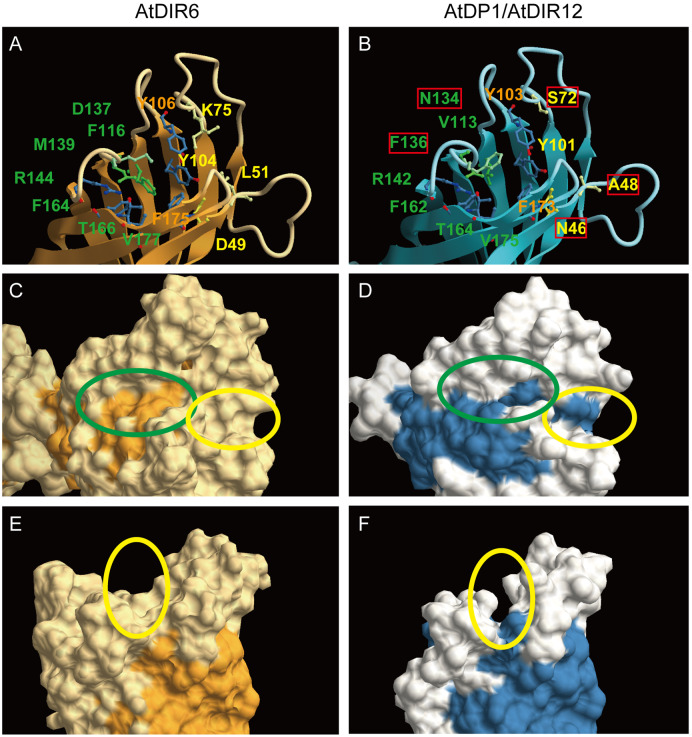
Figure 7.
Homology modeling of AtDP1/AtDIR12 based on the crystal structure of AtDIR6. Active site of AtDIR6 (A) and AtDP1/AtDIR12 (B). Amino acids residues for pocket A (green), pocket B (yellow), and the region between the pockets (orange) are shown. Residues unique to AtDP1/AtDIR12 are shown in red boxes. Molecular surface structures of AtDIR6 (C, E) and AtDP1/AtDIR12 (D, F) are shown. Pockets A and B are shown within green and yellow ovals, respectively. Homology modeling was conducted using the SWISS-MODEL Web site (https://swissmodel.expasy.org/) with AtDIR6 (PDB: 5LAL) as a template. CueMol2 was used for the macromolecular structure visualization (http://www.cuemol.org/en/).

