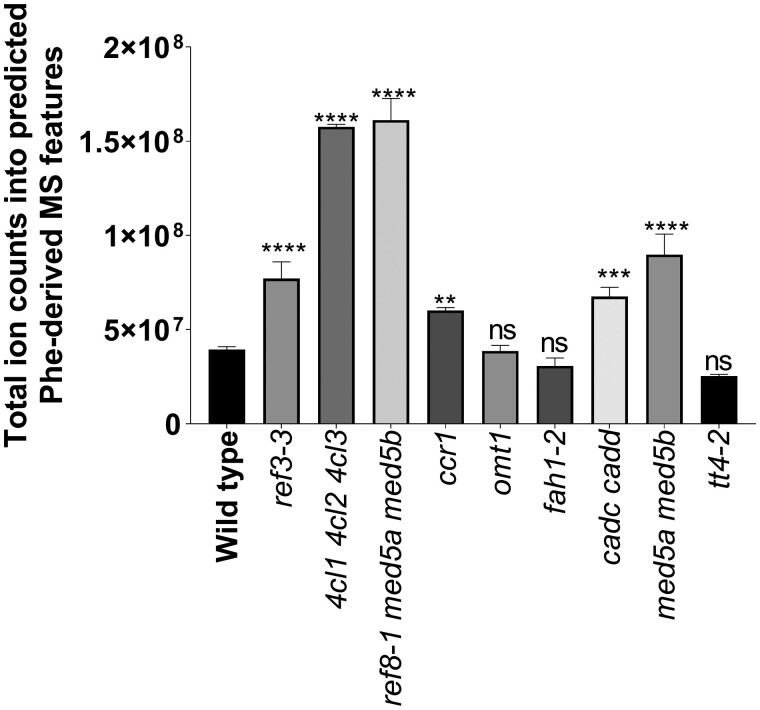
Figure 4.
Aggregate abundance of Phe-derived metabolite features in each genotype. Genotypes significantly different from wild type are denoted by the stars above each bar as determined by one-way ANOVA (****P-value < 0.0001; ***P-value of 0.002; **P-value of 0.0043; ns = not significantly different from wild type) corrected for multiple comparisons using Dunnett’s test. Error bars indicate ±sd of three biological replicates. The plot was computed using the annotated Phe-derived features from samples that were fed with [12C]-Phe.

