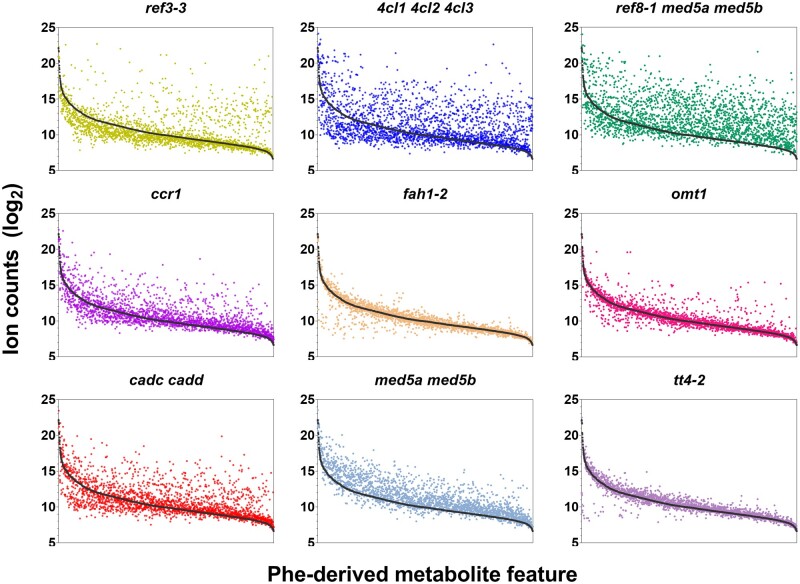
Figure 5.
Abundance of individual Phe-derived metabolite features in wild-type and mutant genotypes. Colored dots in each panel depicts the average accumulation (n = 3) of a single metabolite feature in a mutant in comparison to its accumulation in wild type (black dots). Features are ordered (left to right) based on their abundance in wild type. Error bars are not plotted, to simplify visualization. The plot was computed using the annotated Phe-derived features from samples that were fed with [12C]-Phe. The full FDM can be found in Supplemental Data Set S2.

