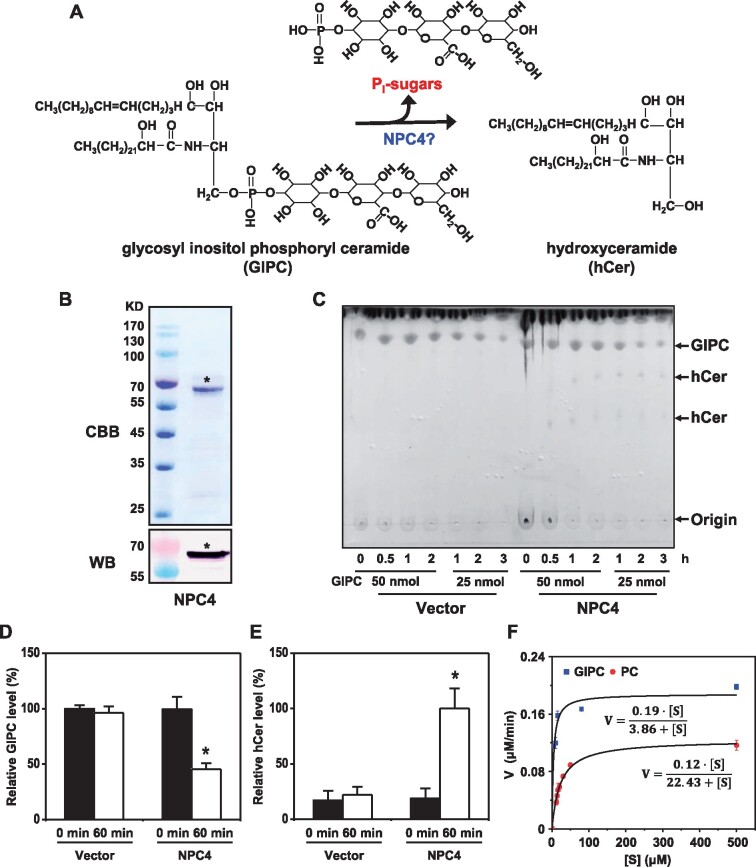
Figure 4.
NPC4 Hydrolyzes GIPC to Generate hCer in vitro. A, Diagram showing NPC4-mediated hydrolysis of GIPC to hCer. B, Coomassie Brilliant Blue staining (upper) and immunoblotting (lower) of purified recombinant NPC4 expressed in E. coli. C, Changes in GIPC levels after incubation of GIPC with purified NPC4. GIPCs were chromatographed in CHCl3/CH3OH/4M NH4OH (9:7:2, by vol) with 0.2 M ammonium acetate. Values are means ± sd (n = 3). *Significant difference compared with vector control at P < 0.05. D, Changes in GIPC levels after incubation of GIPC with purified NPC4. Relative GIPC level (%) refers to GIPC level relative to that of GIPC added to the assay. Values are means ± sd (n = 3). *Significant difference compared with vector control at P < 0.05. E, Production of hCer after incubation of GIPC with purified 10 µg NPC4. Relative hCer level (%) refers to the level of hCer produced by NPC4 after a 60-min reaction. Vector refers to a negative control using an equal volume of eluents from an identically processed sample containing empty vector alone. F, Kinetic parameters of NPC4 hydrolysis of GIPC and PC. GIPC was isolated from Arabidopsis leaves; commercial PC from soybean seeds (Avanti Polar Lipids Inc. 840054P) was used. For GIPC, Km = 3.86 μM; for PC, Km = 22.43 μM. Values are means ± sd (n = 3). Origin 8.0 was used to plot the data and calculate the kinetic parameters.

