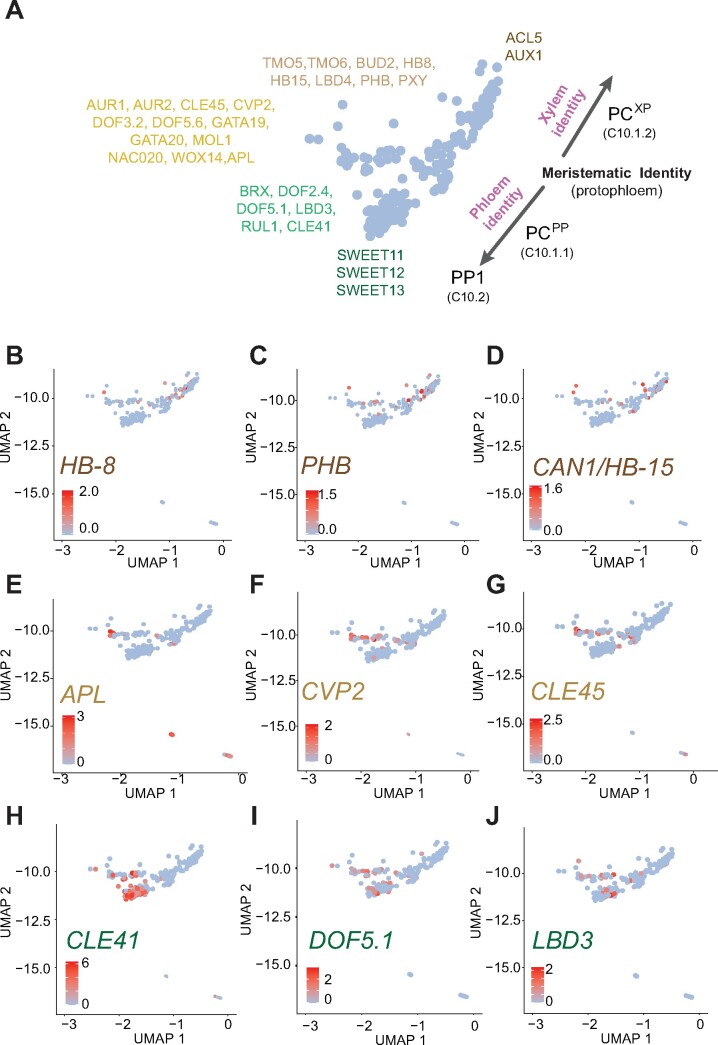
Figure 4.
Identification of the procambium cell cluster with distinct procambium cell identities. (A) Schematics representing subpopulations of Cluster 10. Genes enriched in the subpopulations are indicated. (B–D) UMAP showing enrichment of transcripts of genes related to xylem differentiation. (E–G) UMAP showing enrichment of transcripts of genes related to maintenance of protophloem pluripotency and differentiation. (H–J) UMAP showing the distribution transcripts related to phloem differentiation.

