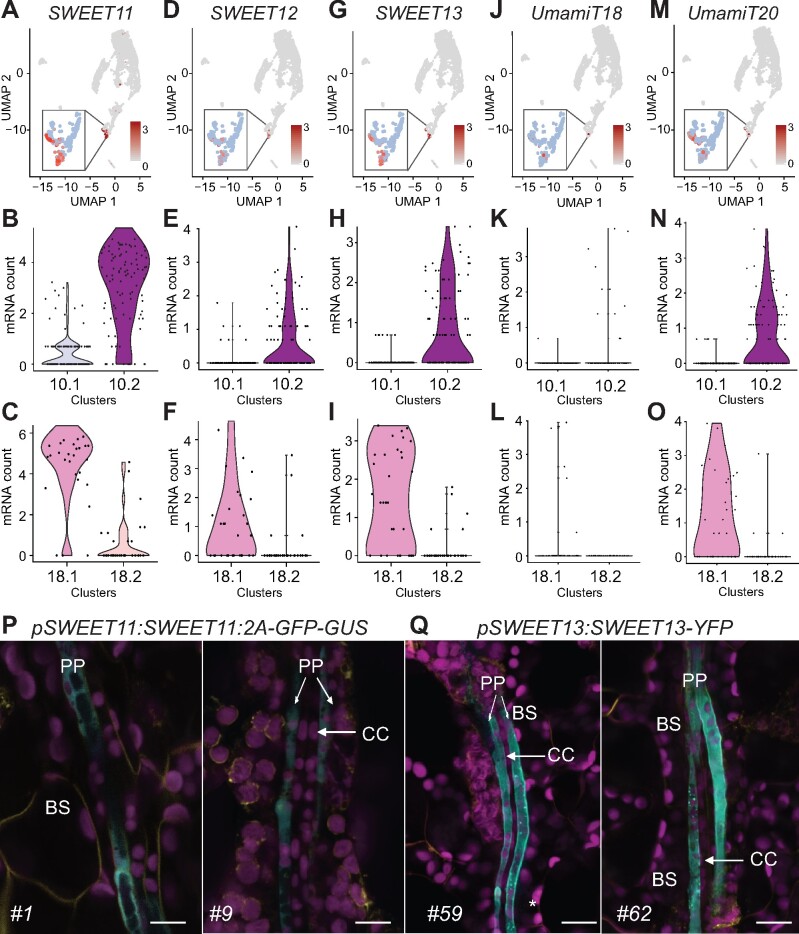
Figure 5.
Three SWEET sucrose transporters and UmamiT amino acid transporters mark the PP cluster. (A–O) UMAP and violin plots of C10 and C18 subclusters showing enrichment of SWEET11 (A–C), SWEET12 (D–F), SWEET13 (G–I), UmamiT18/SIAR1 (J–L), and UmamiT20 (M–O) transcripts in PP clusters. Subcluster 10.1 corresponds to PC, 18.2 to XP3, and 10.2 and 18.1 to PP. Inset show magnification of C10 and C18. (P and Q) Confocal microscopy images of pSWEET11:SWEET11-2A-GFP-GUS (P) and pSWEET13:SWEET13-YFP (Q) leaf showing GFP (P) or YFP (Q) fluorescence specific to PP. Magenta, chlorophyll autofluorescence. Yellow, FM4-64FX. Cyan GFP fluorescence (P) or YFP fluorescence (Q). Scale bars: 10 µm. BS, bundle sheath; CC, companion cell; PP, phloem parenchyma cells are marked. Numbers on the bottom left indicate independent transgenic lines.

