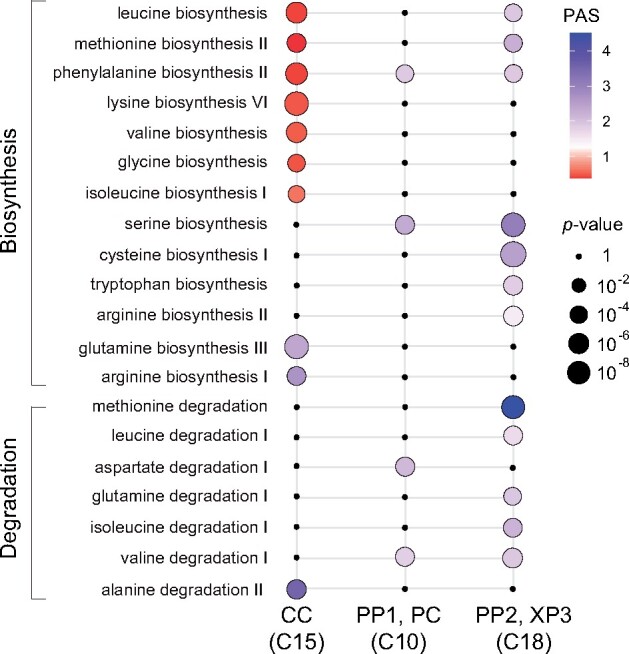
Figure 8.

Amino acid biosynthesis and degradation pathways are differentially represented in the CC, PP, PC, and XP3 cells. Metabolic pathway activities of amino acid biosynthesis and degradation pathways in Clusters 15, 10, and 18. Statistical significance is represented as differences in dot size. Statistically insignificant values are shown as black dots (random permutation test, P >0.05). Colors represent the PAS; a score 1 (violet) indicates a higher activity. Activities were compared between all clusters in the scRNA-seq data set.
