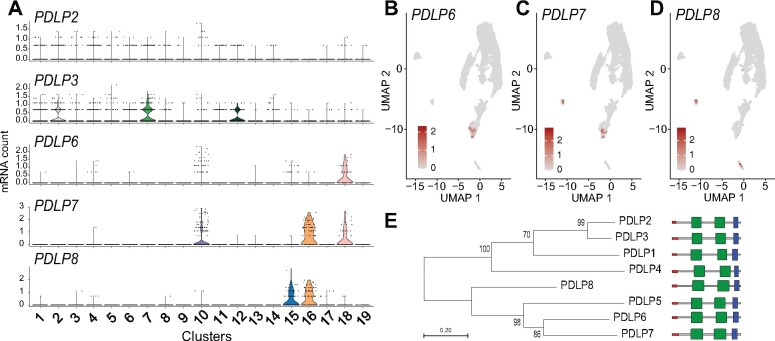
Figure 9.
Transcript enrichment of PDLP genes in vascular cell types. (A) Violin plot showing transcript enrichment of PDLPs. (B–D) UMAP plot showing the enrichment of PDLP6 (B), PDLP7 (C), and PDLP8 (D) transcripts in the PP clusters (B and C), guard cell cluster (C and D), and CC cluster (D). (E) Phylogenetic analysis of PDLPs in Arabidopsis. The phylogenetic tree was generated with the maximum likelihood method implemented in PhyML (Lemoine et al., 2019). Percent support values from 1,000 bootstrap samples are shown. Protein motifs predictions are based on the SMART database (http://smart.embl-heidelberg.de). DUF26 domains, transmembrane region, and signal peptide are shown in green, blue, and red, respectively.

