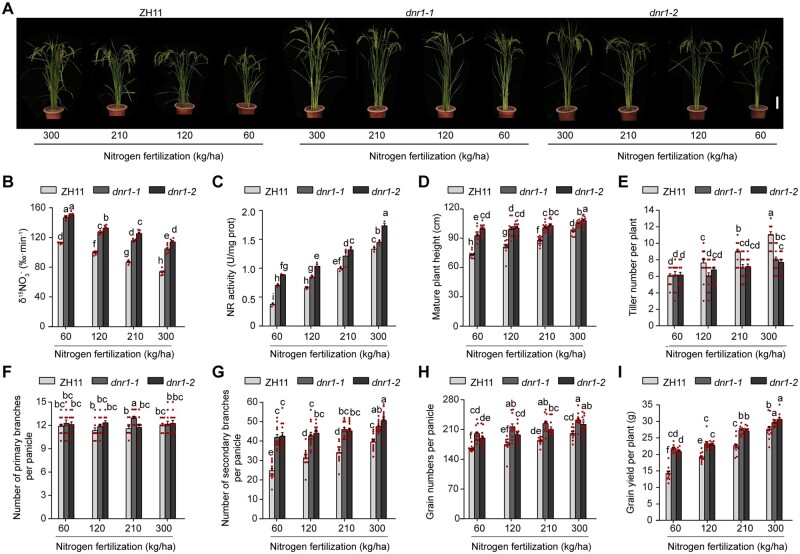
Figure 6.
dnr1 mutants have increased grain yield and NUE. (A) Morphology of mature ZH11, dnr1-1, and dnr1-2 plants supplied with different levels of N. Scale bar, 15 cm. (B) 15 uptake rate in roots. Data are mean ± sem (n = 6). (C) NR activity. Data are mean ± sem (n = 3). (D) Plant height. Data are mean ± sem (n = 16). (E–I) Number of tillers per plant (E), number of primary branches per plant (F), number of secondary branches per plant (G), number of grains per panicle (H), and grain yield per plant (I) of ZH11, dnr1-1, and dnr1-2 plants. Data are mean ± sem (n = 12). (B–I) Different letters denote significant differences (P < 0.05) from Duncan’s multiple range test.

