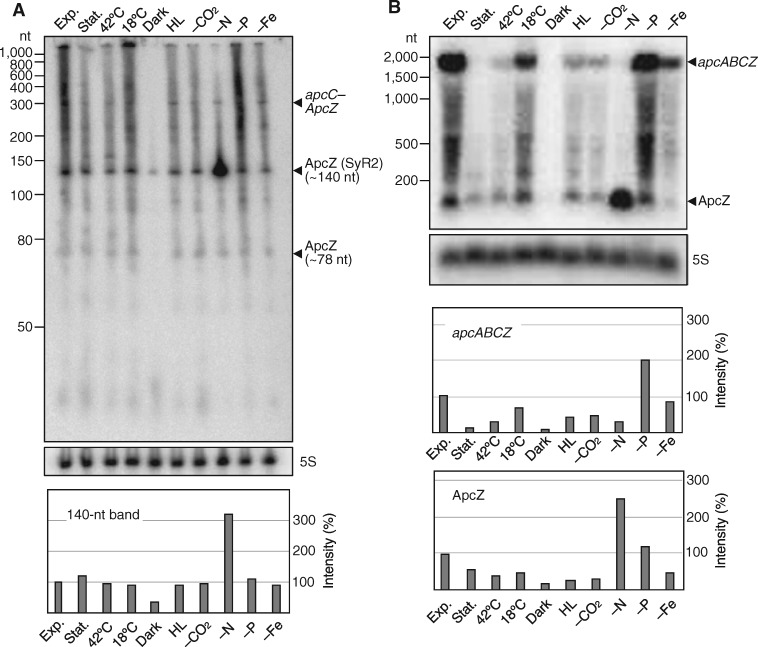
Figure 2.
ApcZ belongs to transcripts of different lengths. (A) RNA gel blot of total RNA using a 32P-labeled transcript probe specific for ApcZ after separation of 12 µg RNA each isolated from cultures grown under 10 different conditions on a denaturing 10% polyacrylamide gel. (B) RNA gel blot hybridization of the same samples after electrophoretic separation on a 1.5% denaturing agarose gel. The full-length tetracistronic transcript (apcABCZ) and ApcZ accumulate differently under different growth conditions. Labels are as follows: exp. (exponential phase), stat. (stationary phase), 42°C (heat stress), 18°C (cold stress), dark (darkness), HL (high light stress), -CO2 (limitation in inorganic carbon supply), -N (nitrogen limitation), -P (phosphorus limitation), and -Fe (iron limitation). A hybridization for the 5S rRNA was used for a loading control. Lower panels: The image processing program ImageJ (version 1.52a) was used to compare the density of selected bands after hybridization. Lane profile plots were generated by outlining lanes with the rectangular selection tool. Peaks of interest were enclosed by drawing a base line. The size of this enclosed area was measured by using the wand tool. These arbitrary numbers were used to express the density of each band. 5S values were normalized by dividing each 5S value by the mean value of all 5S bands. ImageJ numbers for each lane were then divided by the normalized 5S value and each value was plotted relative to the exponential phase standard in %.

