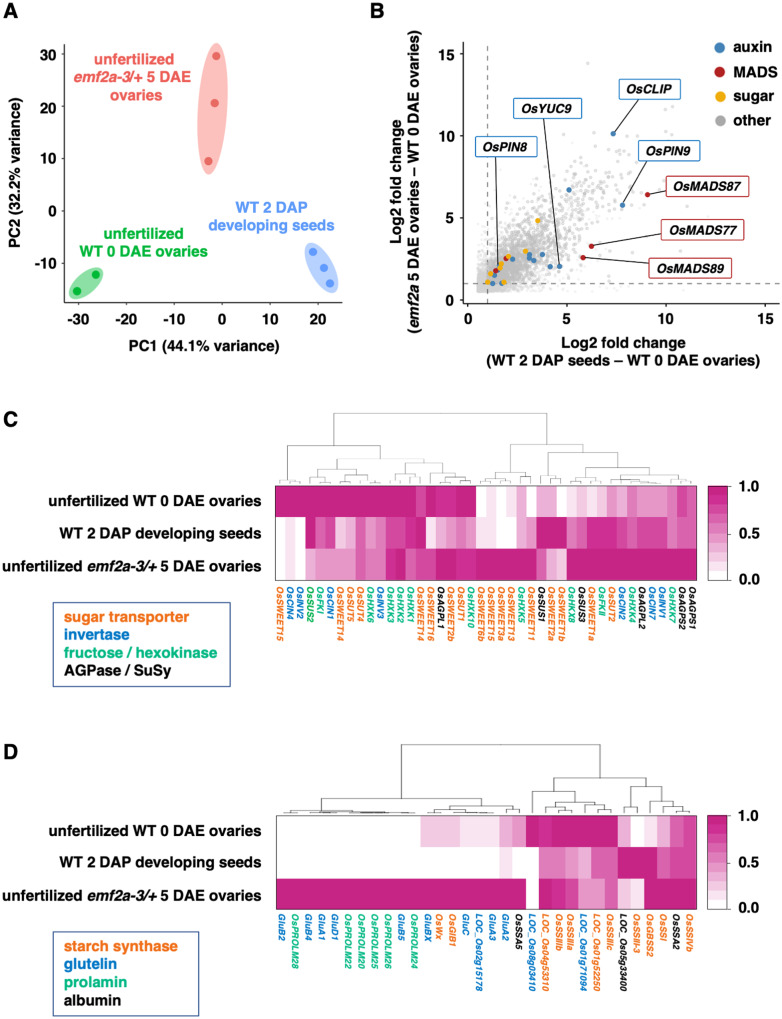
Figure 2.
Transcriptome analysis of autonomous endosperm development in emf2a-3/+. (A) PCA of variance in normalized read counts for whole transcriptomes in three different libraries prepared from unfertilized wild-type 0 DAE ovaries (green), fertilized wild-type 2 DAP developing seeds without embryos (blue), and unfertilized emf2a-3/+ 5 DAE enlarged ovaries (red), with two or three replicates. The two axes represent the first two principal components (PCs) and the percentages indicate the variance contribution. (B) Scatter plot of commonly upregulated genes in two comparisons: fertilized wild-type 2 DAP developing seeds versus unfertilized wild-type 0 DAE ovaries (X-axis); unfertilized emf2a-3/+ 5 DAE ovaries versus unfertilized wild-type 0 DAE ovaries (Y-axis). Gray points are upregulated genes, and colored points indicate related pathways of gene families for auxin, MADS-box, sugar, and others (detailed information is given in Supplemental Figure 5). The two stippled axes show log2 fold changes in expression of upregulated genes in the two comparisons. (C) and (D) Heatmaps of hierarchical clustering of DEGs that show a higher expression state in unfertilized emf2a-3/+ 5 DAE ovaries with respect to the sugar metabolism pathway (C) and for storage compounds (D). For each gene, the average transcripts per million value normalized by the maximum value of the gene is shown. The different colors of the gene names indicate encoded proteins of each gene.

