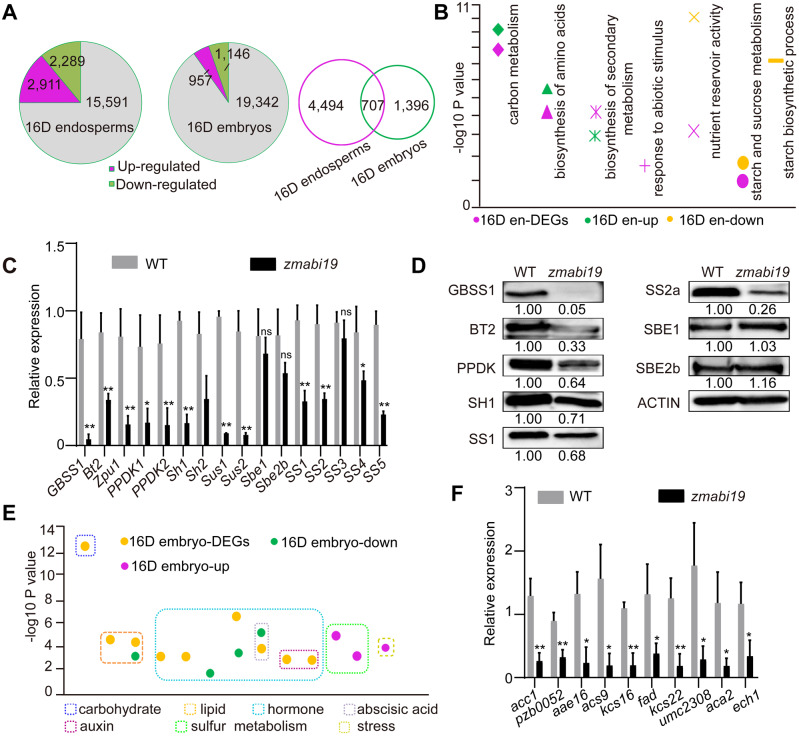
Figure 7.
Comparison of transcriptomes between wild-type and zmabi19-1 endosperms and embryos at 16 DAP. (A) Pie chart of DEGs between (left) wild-type and zmabi19-1 endosperms and (middle) embryos and Venn diagram showing the overlap between DEGs in (right) endosperms and embryos. (B) Enrichment analysis of DEGs in 16-DAP endosperms. 16D en-DEGs, all DEGs; 16D en-up, upregulated DEGs in zmabi19; 16D en-down, downregulated DEGs in zmabi19-1; D, DAP; en, endosperm. (C) RT-qPCR analysis of starch biosynthetic genes in wild-type and zmabi19-1 seeds. All expression levels were normalized to that of Actin. Error bars represent SD of three biological replicates. *P < 0.05; **P < 0.01; ns, no significant difference. (D) Immunoblot analysis of starch biosynthetic proteins in wild-type and zmabi19-1 seeds at 16 DAP. The number below each lane indicates the protein levels relative to the values in wild type set as 1, which were all normalized against ACTIN. (E) Enrichment analysis of DEGs in 16-DAP embryos. 16D embryo-DEGs, all DEGs; 16D embryo-down, downregulated DEGs in zmabi19-1; 16D embryo-up, upregulated DEGs in zmabi19-1; D, DAP. (F) RT-qPCR analysis of genes involved in lipid biosynthesis and metabolism in wild-type and zmabi19-1 seeds at 16 DAP. All expression levels were normalized to that of Actin. Error bars represent SD of three biological replicates. *P < 0.05; **P < 0.01.

