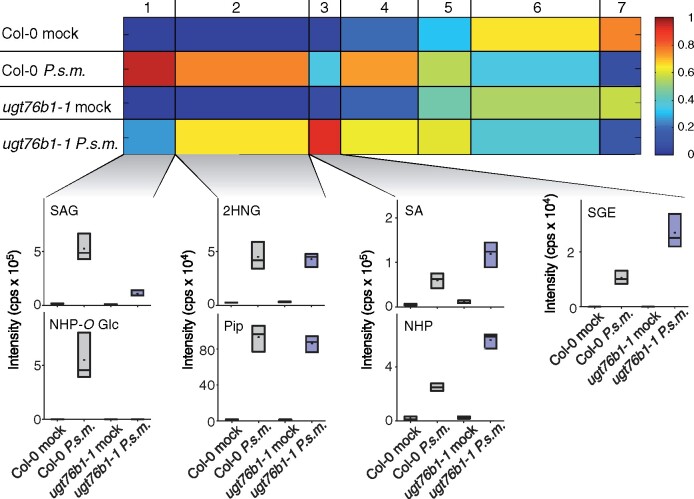
Figure 2.
Nontargeted metabolomics revealed NHP as a substrate of UGT76B1 in vivo. Col-0 and ugt76b1-1 mutant plants were infiltrated with MgCl2 (mock) or Pseudomonas syringae ES4326 (P.s.m.) at OD600 = 0.05. Samples were collected 24 hpi. Metabolites of the polar extraction phase were analyzed by a metabolite fingerprinting approach based on UHPLC-HRMS. Intensity-based clustering by means of one-dimensional self-organizing maps of the relative intensities of 448 metabolite features (FDR < 0.005) in seven clusters is shown. The heat map colors represent average intensity values according to the color map on the right-hand side. The width of each cluster is proportional to the number of features assigned to this cluster. Box plots for selected metabolites of the indicated clusters are shown. Borders represent the high and low value of the measurement and horizontal lines represent the median value. The identity of the metabolites was unequivocally confirmed by UHPLC-HRMSMS analyses. Data represent n = 3 replicates. Each replicate represents an individual pool of 4–6 leaves of six plants per condition. The results were confirmed by a second independent experiment.

