Figure 2.
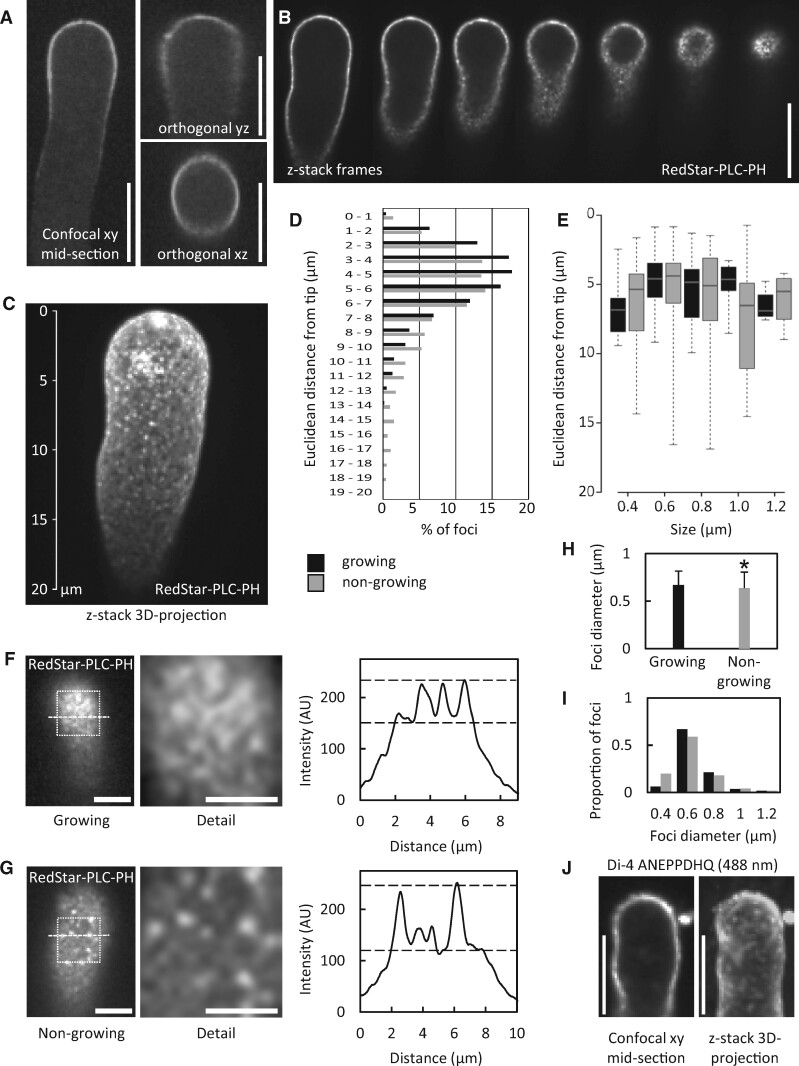
A PtdIns(4,5)P2 biosensor decorates membrane nanodomains in the subapical plasma membrane of tobacco pollen tubes. The fluorescence distribution of the PtdIns(4,5)P2-specific reporter RedStar-PLC-PH was monitored upon transient expression in tobacco pollen tubes by SD. A, Projections of confocal z-stacks with xy, yz, and xz orientations of a representative pollen tube expressing RedStar-PLC-PH. Scale bars, 10 µm. B, Sequence of images extracted from SD z-stack acquisition (0.3-µm slices) of tobacco pollen tubes expressing RedStar-PLC-PH (from median confocal plane to the cell surface). PtdIns(4,5)P2 nanodomains are visible as bright dots at the cell surface. Please note the absence of fluorescence at the cell interior. Scale bar, 10 µm. C, 3D projection from a z-stack acquisition (0.3-µm slices) of a representative pollen tube expressing RedStar-PLC-PH. Scale as indicated. D, Distribution of PtdIns(4,5)P2 nanodomains over the Euclidean distance from the pollen tube tip, as determined for growing pollen tubes (black bars) or for nongrowing pollen tubes (grey bars). The analysis is based on 8,881 nanodomains from 8 cells (growing) or 17,204 nanomonains from 10 cells (nongrowing). E, Size distribution of nanodomains decorated by RedStar-PLC-PH along the tips of growing (black bars) or nongrowing pollen tubes (grey bars) over the Euclidean distance from the pollen tube tip. Data represent 221 nanodomains from 8 cells (growing); or 227 nanodomains from 10 cells (nongrowing), respectively. For the box plots, quartiles were first defined by numerically ordering the recorded values: The median divides the number of values in two halves, which are each further divided into quartiles. The ends of the box represent the upper and lower quartiles of recorded values, so the box spans the interquartile range. The median of all recorded values is marked by a horizontal line inside the box. The whiskers extend to the highest and lowest recorded values. F, G, The intensities of PtdIns(4,5)P2 nanodomains decorated by RedStar-PLC-PH were recorded by SD in cell surface scans of growing (F) or nongrowing pollen tubes (G). Left panels, representative SD images of the cell surface. Scale bars, 5 µm. White boxes, regions of interest enlarged in middle panels (scale bars there, 3 µm). Right panels, fluorescence intensity plots derived from dashed lines in left panels. Dashed lines in the intensity plots, estimated levels of diffuse marker fluorescence (lower line) and of nanodomain fluorescence (upper line). H, Mean nanodomain diameters were calculated for growing (black bar) or nongrowing pollen tubes (grey bar) from the data shown in (E). Data are given as means ± standard deviation. The asterisk indicates a significant difference according to a Student’s t test (*p≤0.05). I, The distribution of size categories of nanodomain diameters was scored in growing (black) and in nongrowing pollen tubes (grey). The distribution was calculated from the same data as shown in (H). J, Tobacco pollen tubes were stained with the membrane dye, Di-4 ANEPPDHQ, to test for unequal lipid distribution in the plasma membrane. During very weak labeling and with excitation at 488 nm, a spotty fluorescence distribution was observed. The cell shown is a growing pollen tube and representative for 12 stained cells observed.

