Figure 1.
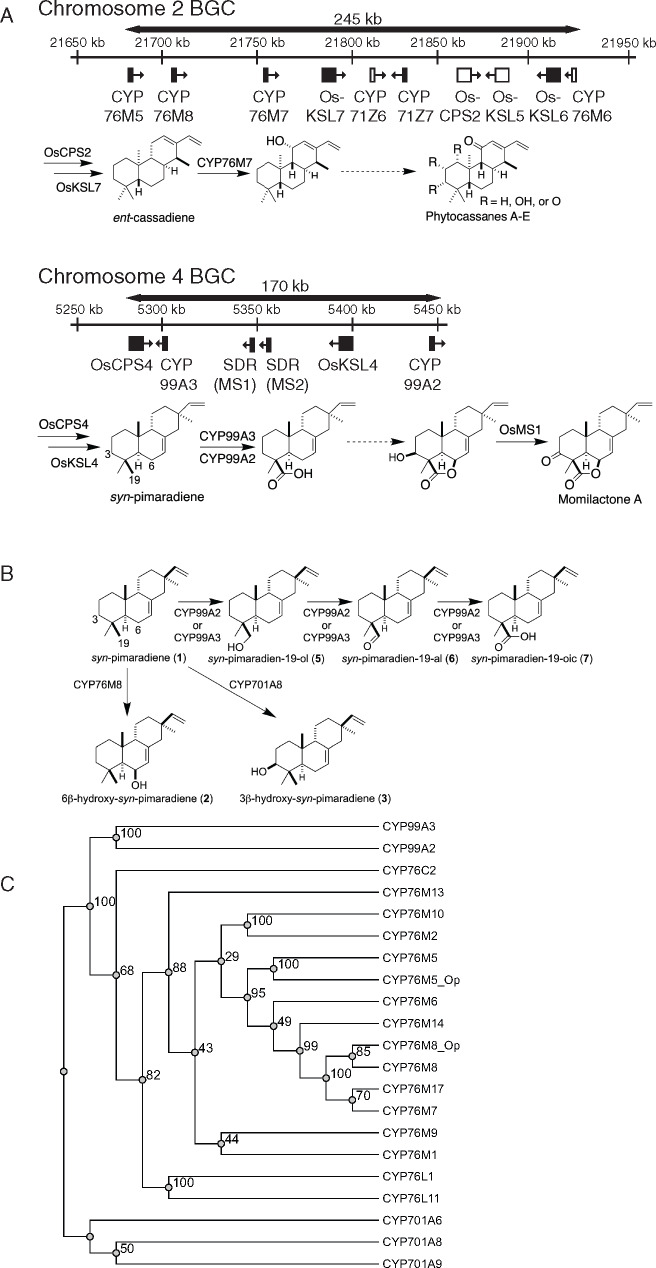
Biosynthetic gene clusters (BGCs) and labdane-related diterpenoid metabolism in rice. (A) Schematic of rice BGCs and associated metabolic pathways. Filled black boxes represent genes induced by chitin elicitation, while empty white boxes represent those not induced (Okada et al., 2007), with arrowheads indicating the direction of transcription. The reactions catalyzed in the characteristic biosynthetic pathways by enzymes encoded within each BGC are indicated as described in the text, while dotted arrows represent multiple unknown steps. (B) Known activities of rice CYPs with syn-pimaradiene (1). (C) Phylogenetic tree for the rice CYP76M sub-family, along with other CYPs associated with momilactone biosynthesis in rice (numbers indicate bootstrap values).

