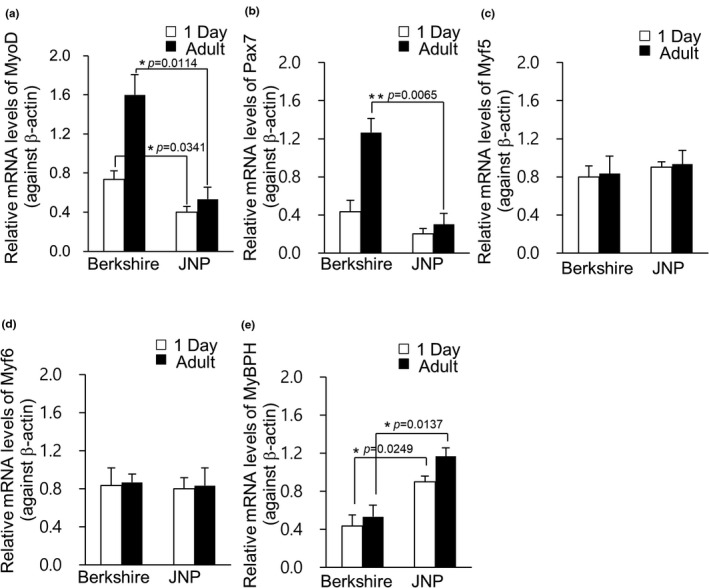
FIGURE 1.

Transcription levels of MRFs. Quantitative reverse transcription‐polymerase chain reaction (qRT‐PCR) analysis was performed in Berkshire and Jeju native pigs (JNP). The expression levels of MyoD (a), Pax7 (b), Myf5 (c), Myf6 (d) and MyBPH (e), normalized against β‐actin were represented. Values were presented as mean ± standard error of mean (s.e.m.) (*p < .05 and **p < .01; two‐tailed t‐test). JNP: Jeju native pig
