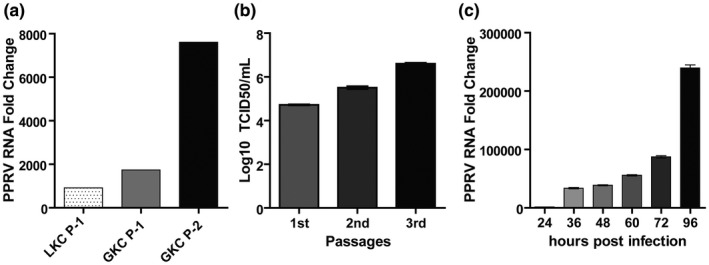
FIGURE 5.

Quantification of PPRV in infected primary goat and lamb kidney cells. (a) PPRV loads expressed as fold change (2−ΔCt) over infected control in the supernatant of primary goat and lamb kidney cell cultures. Here, LKC‐P1: Lamb kidney cells passage 1, GKC‐P1 and P2: Goat kidney cells passage 1 and 2. (b) Titration of PPRV in the supernatant of infected primary goat kidney cells during three consecutive passages by TCID50 method. (c) PPRV RNA expressed as fold change (2−ΔCt) over uninfected control in the supernatant of primary goat kidney cells infected with PPRV at different time post infection. Data indicate mean ± SEM (b–c)
