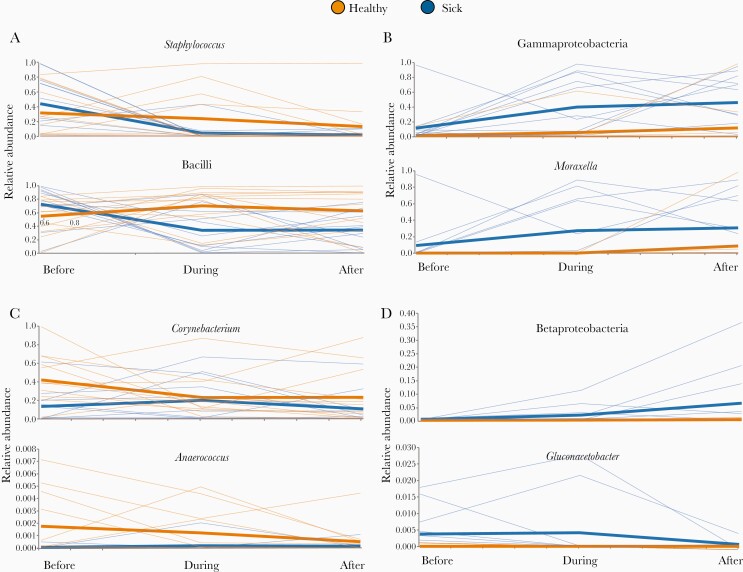
Figure 2.
Relative abundances (y-axes) of select taxa at all 3 time points (x-axes) in the longitudinal cohort. Each thin line corresponds to the abundance of a given taxon in a particular individual, while the thick lines show the mean abundance of each group at each time point. Members of the healthy group are orange and members of the group that developed infection are blue. Significant taxa were grouped based on different temporal patterns of abundance with respect to illness, and each panel contains examples from a different group: (A) similar abundance between infection and healthy groups prior to illness, but decreased during and after illness in subjects that become infected; (B) consistently elevated in the illness group; (C) elevated in the healthy group before and during illness, but not after; and (D) idiosyncratic temporal dynamics observed in each taxon. Of the members of the fourth group shown here, Betaproteobacteria is nearly absent from all subjects at the preillness time point, and then becomes increasingly abundant during and after illness in the infection group while remaining nearly absent from the healthy group. Gluconacetobacter is elevated in the infection group prior to and during illness, and substantially diminishes in abundance with convalescence.

