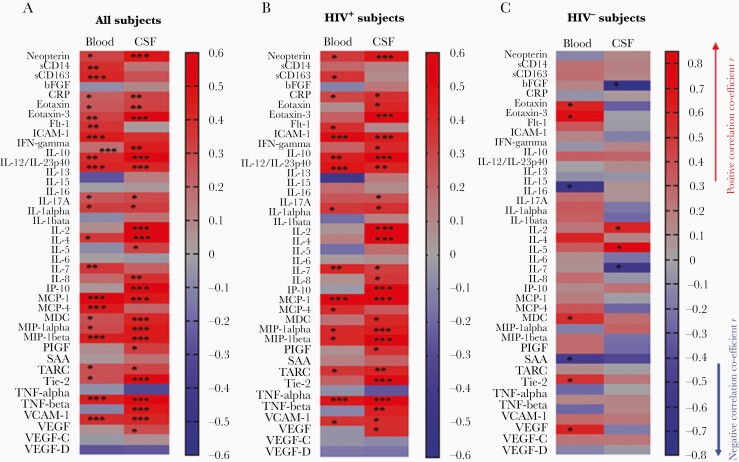
Figure 2.
Correlation coefficient r and P values between plasma lipopolysaccharide (LPS) levels and inflammation in plasma and cerebrospinal fluid (CSF) samples. Plasma and CSF levels of 40 proinflammatory cytokines and neuropathologic markers were evaluated using MSD neuroinflammation kit or enzyme-linked immunosorbent assay. The Spearman correlation coefficient (r values in red: positive correlations; blue: negative correlations) and P values between plasma LPS levels and levels of inflammatory markers in the plasma and CSF in all subjects (A), human immunodeficiency virus–infected (HIV+) subjects (B), and HIV-negative subjects (C). *P < .05; **P < .001; ***P < .0001.

