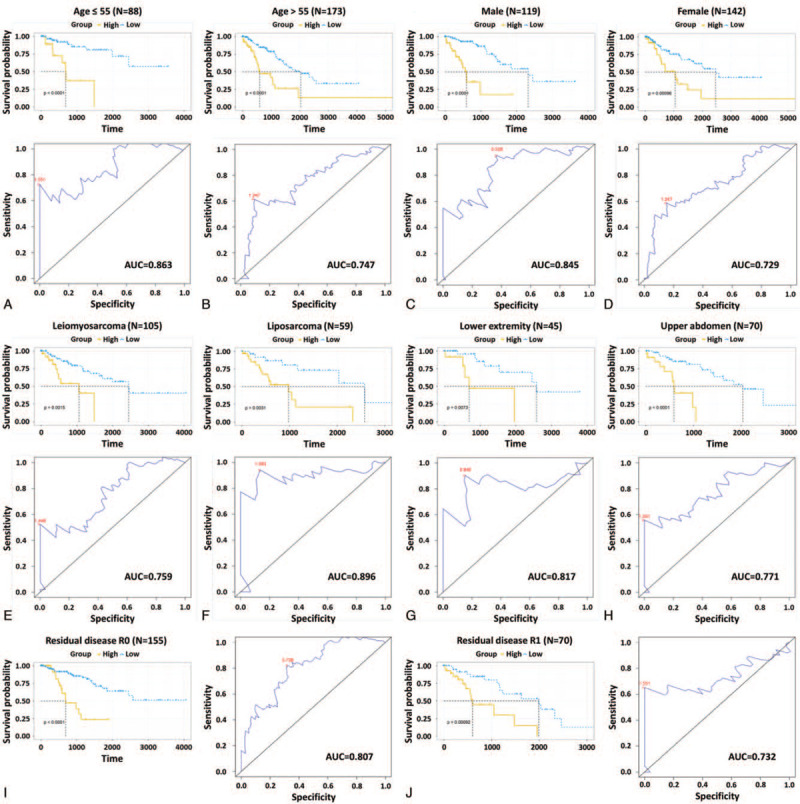
Figure 3.

Kaplan–Meier and ROC analyses of sarcoma patients with different ages (A and B), genders (C and D), histological subtypes (E and F), anatomic locations (G and H), and residual disease R classifications (I and J). Kaplan–Meier estimates of the patients’ OS and ROC curves show the sensitivity and specificity of the 3-DNA methylation signature in predicting the patients’ OS. OS = overall survival, ROC = receiver operating characteristic.
