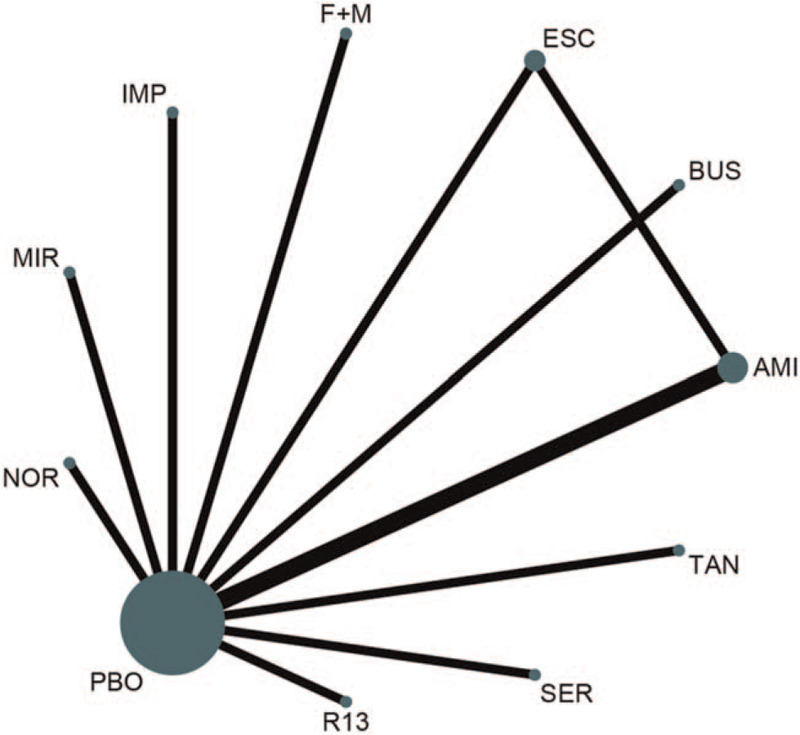
Figure 2.

Network of eligible comparisons for all relevant articles. The thickness of the lines between the nodes represents the number of trials comparing every pair of treatments, and the size of the nodes is proportional to the sample number. F + M = flupentixol + melitracen; BUS = buspirone; MIR = mirtazapine; TAN = tandospirone; IMI = imipramine; AMI = amitriptyline; PBO = placebo; ESC = escitalopram; SER = sertraline; NOR = nortriptyline; R13 = R137696.
