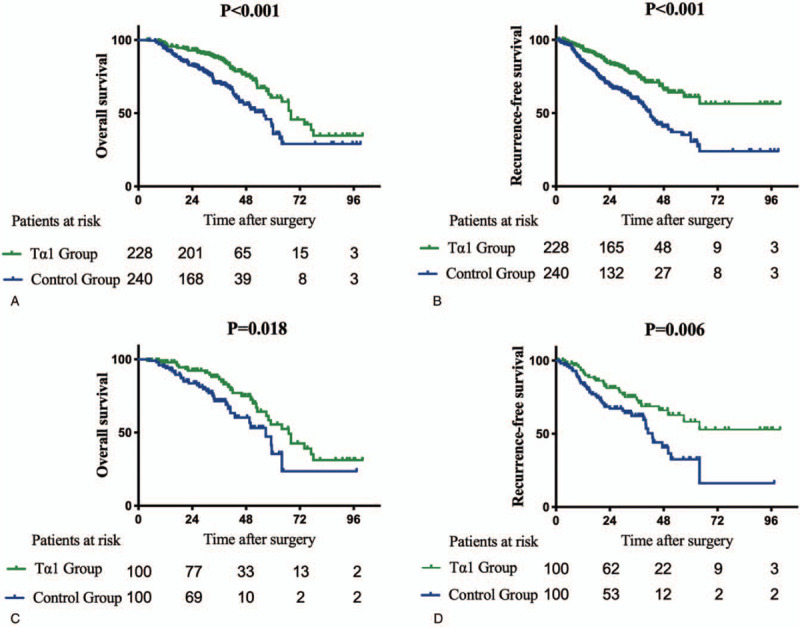
Figure 2.

Survival curves of the control groups and Tα1 groups in the entire cohort and propensity matched cohort. (A-B) Overall survival and Recurrence-free survival of control group and Tα1 group in the entire cohort. (C-D) Overall survival and Recurrence-free survival of control group and Tα1 group in the propensity matched cohort.
