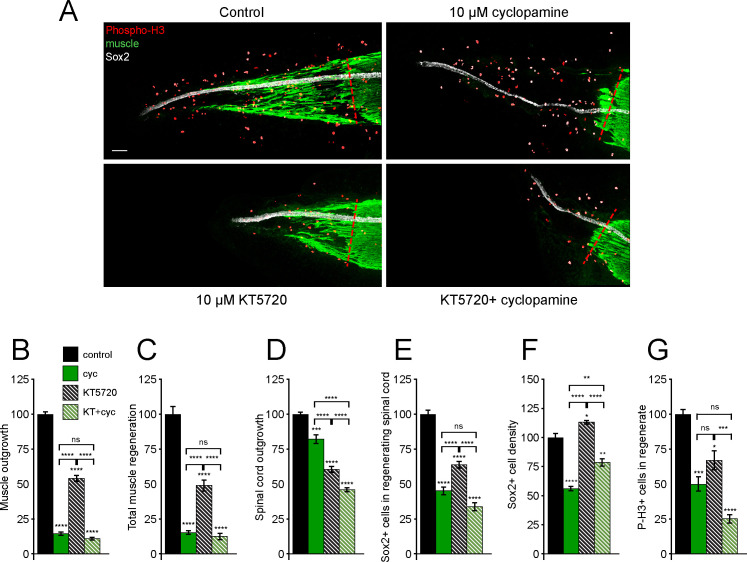
Figure 5. Tissue-specific interaction between PKA and Smoothened (Smo) signaling in regulation of spinal cord and muscle regeneration.
Stage 39–40 larvae were incubated for 72 h after tail amputation in vehicle (0.1% DMSO, Control), PKA antagonist (10 µM KT5720, KT), or/and 10 µM cyclopamine (cyc). (A) Images show representative samples for each group at 72 h post amputation (hpa). Transverse red dashed line indicates amputation plane. Scale bar, 100 µm. (B–G) Graphs show mean ± SEM regenerated muscle outgrowth (B) and total volume (C), regenerated spinal cord outgrowth (D), total number (E) and per length density (F) of Sox2+ cells in the regenerated spinal cord, and overall number of phospho-histone H3+ (P-H3+) cells (G) in the regenerate at 72 hpa as % of cohort-matched control, n of larvae: 11–29 per group, N of experiments ≥ 3. *p<0.05, **p<0.01, ***p<0.001, ****p<0.0001, ns: not significant, ordinary one-way ANOVA, Brown–Forsythe and Welch ANOVA, or Kruskal–Wallis test, followed by Tukey’s, Dunnett’s T3, or Dunn’s multiple comparisons test, respectively, according to prior normality and equality of SDs within and between groups.

