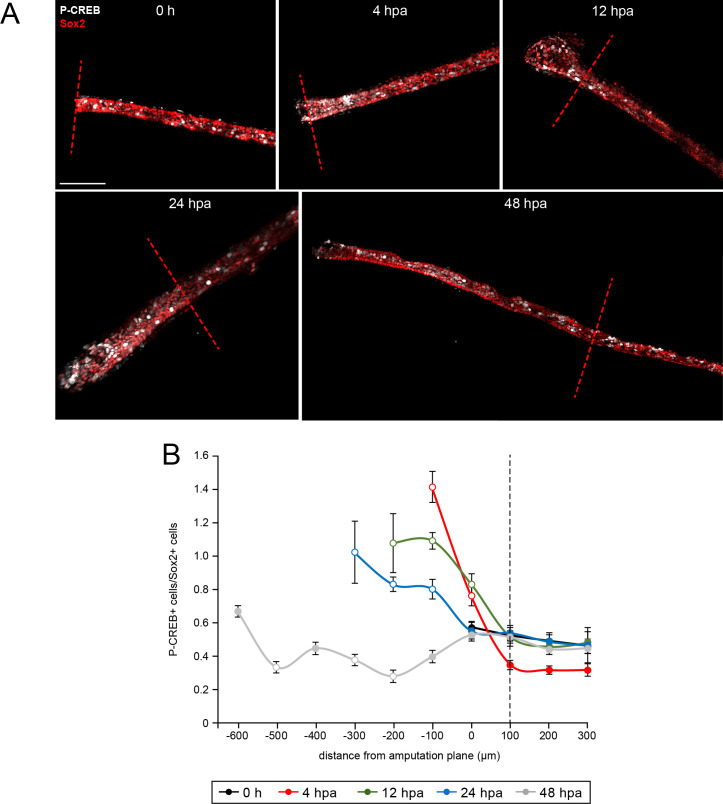
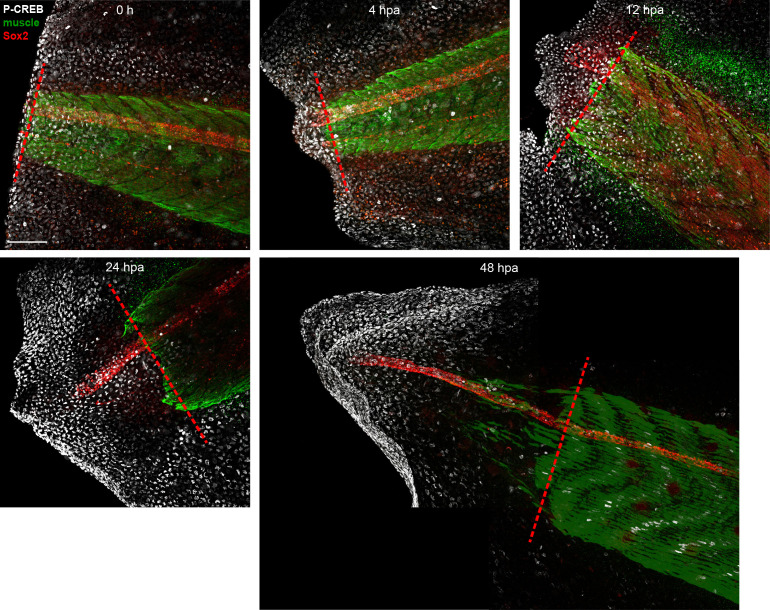
Figure 6. Spatiotemporal activation of CREB in the injured and regenerated spinal cord.
Stage 39–40 larvae were amputated and processed for whole-mount immunostaining at the indicated hour post amputation (hpa), with the exception of the 0 h group, which was first fixed and then amputated to represent the pre-amputation group. (A) Images show representative z-projections of immunostained samples for each group that were digitally processed to isolate spinal-cord associated P-CREB. Transverse red dashed line indicates amputation plane. Scale bar, 100 µm. (B) Graph shows mean ± SEM number of total P-CREB+ cells normalized to number of Sox2+ cells in 100 µm sections of spinal cord anterior (positive) and posterior (negative) to the amputation plane (0). N of larvae ≥5 per group. Open circles denote p<0.05 vs. time-matched average number of P-CREB+/Sox2+ cells within the region 100–200 µm anterior (100 µm, dashed black line) to the amputation plane (0 µm), one-way ANOVA.


