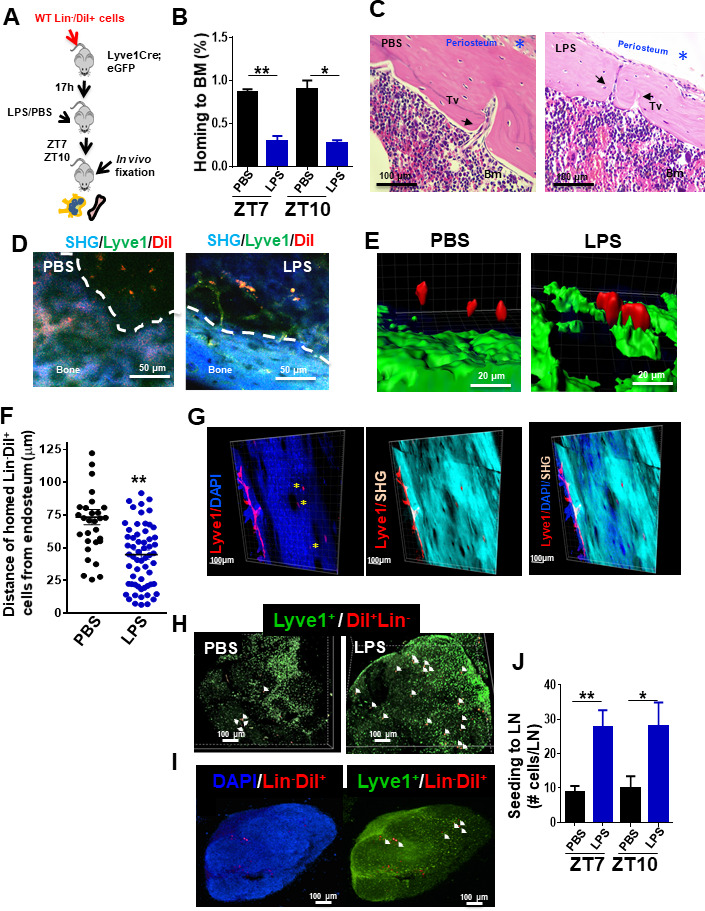
Figure 2. Draining of bone marrow (BM)-derived lineage negative cells into lymphatics.

(A) Schema for adoptive transfer of BM-derived lineage negative cells (Lin-) labeled with 1,1'-dioctadecyl-3,3,3',3'-tetramethylindocarbocyanine perchlorate (DiI) dye into lymphatic endothelium reporter Lyve1eGFP mice. By 16 hr after cell transplantation, lipopolysaccharide (LPS) or PBS were administered into the Lyve1eGFP mice at zeitgeber time (ZT)4 (10 am; time of LPS administration). BM and lymph node (LN) cells were analyzed at ZT5.5 (11.30 am, 1.5 hr after LPS administration), ZT7 (1 pm, 3 hr after LPS administration), and ZT10 (4 pm, 6 hr after LPS administration) for labeled Lin- cells (Lin-/DiI+). (B) Frequency of Lin-/DiI+ homed to BM (solid bars) (mosaic bars) after PBS (black solid bar) or LPS (blue solid bar) administration at ZT7 (1 pm, 3 hr after LPS administration) and ZT10 (4 pm, 6 hr after LPS administration). (C) Representative 3D reconstruction images of the whole bone by two-photon microscopy showing lymphatic vessels (Lyve1) surface marker (red), nuclei with DAPI (blue), and cortical bone with second harmonic signal (SHG, light blue). The scale bars, 100 μm. (D, i–iv) Intravital two-photon microscopy imaging (IVM) of long bones from Lyve1eGFP mice showing lymphatic vessels (displayed in green) near to the surface of the bone (blue, detected by SHG signal) and homed Lin-/DiI+ cells (displayed in red). (i, iii) IVM of PBS specimen. (ii, iv) IVM of LPS specimen. (E, F) Analysis and quantification of the distance of homed Lin-/DiI+ (red) cells to Lyve1eGFP (green) cells after PBS/LPS administration at ZT5.5 (11.30 am, 1.5 hr after LPS administration) analyzed by Imaris 7.7.2 software. (G) Two-photon microscopy examples of images of longitudinal femoral sections stained with anti-Lyve1 antibody and DAPI, and analyzed for specific fluorescence signal and SHG for cortical bone. (H, I) Representative of 3D reconstitution images of PBS- and LPS-treated LN tissues (H) and cross-sections of LPS-treated LN (I) analyzed by confocal microscopy showing the location of mobilized Lin-/DiI+ cells (red; nucleus stained by DAPI in blue) in relation with Lyve1+ cells (green; nucleus stained by DAPI in blue). The Z-stack dimensions of upper panels were X = 1266.95 μm, Y = 1266.95 μm, and Z = 344 μm. Calibrate: XY = 2.47 μm and Z = 4 μm. Resolution: 512 × 512 × 86. The Z-stack dimensions of lower panels were: X = 1259.36 μm, Y = 1259.36 μm, and Z = 132 μm. Calibrate: XY = 2.46 μm and Z = 4 μm. Resolution of images was 512 × 512 × 86. (J) Absolute count of mobilized Lin-/DiI+ cells counted within LN at ZT7 (1 pm, 3 hr after LPS administration, solid bars) and ZT10 (4 pm, 6 hr after LPS administration, mosaic bars) after PBS/LPS administration. N = 4–14 LNs analyzed per time point in a minimum of three mice per group and/or time point. Graph data depict mean ± SD. *p<0.05, **p<0.01.
