. 2021 Apr 8;10:e66190. doi: 10.7554/eLife.66190

Figure 4. Traf6 is a key regulator for migration of bone marrow (BM)-derived myeloid progenitors to lymph nodes (LNs) in a non-cell-autonomous manner.

(A) Schema of full chimeric mice made by non-competitive transplantation of CD45.2+ Mx1Cre;WT and Mx1Cre;Traf6flox/flox BM cells into lethally irradiated CD45.1+ B6.SJLPtprca Pep3b/BoyJ. Six weeks later Traf6 gene were deleted by intraperitoneal injection of poly(I:C). 1 week later we performed PBS/lipopolysaccharide (LPS) injection early in the rest phase (zeitgeber time [ZT]4 [10 am, time of LPS administration]) and LN-contained myeloid progenitors at ZT7 (1 pm, 3 hr after LPS administration) was scored by colony-forming unit (CFU) assay. (B) Absolute number of CFU-GM present in LN from wild-type (WT) (solid bars) and Traf6∆/∆ (orange bars) full chimeric mice (n = 6–7 mice per group) after PBS (black and orange solid bars) or LPS (blue and mosaic bars) administration. (C–H) In vitro transwell migration assay for BM-derived LK cells. (C) Experimental design for migration of WT or Traf6∆/∆ low-density (LD) BM cells (CD45.2+) toward a WT microenvironment generated by BM (CD45.1+) in the presence of LPS for 4 hr. (D) Graph represents the percentage migrated LK from WT (blue solid bar) or Traf6∆/∆ (orange mosaic bar) low-density BM (LDBM) cells to the bottom as depicted in (C). (E) Experimental design for migration of WT LDBM cells (CD45.1+) toward a gradient generated by WT or Traf6∆/∆ (CD45.2+) BM or LN cells in the presence of LPS for 4 hr. (F) Graph represents the percentage of LDBM LK migrated to the BM bottom (solid bars) or LN bottom (mosaic bars) as schemed in (E). (G) Experimental design for WT LDBM cells (CD45.1+) migration toward gradient generated by WT or Traf6∆/∆ LN-derived T-cells (CD45.2+/CD3e+/CD11b-/B220-) or B-cells (CD45.2+/CD3e-CD11b-/B220+) or myeloid cells (CD45.2+/CD3e-/CD11b+/B220-) in the presence of LPS for 4 hr. (H) Graph represents the percentage of migrated LK LDBM to the WT LN bottom (blue mosaic bars) or Traf6∆/∆ LN bottom (orange mosaic bars) as schemed in (G). In all cases, LK cell migration was determined by CD45 allotype analysis using flow cytometry in triplicate. (I) Absolute number of CFU-GM present in LN from Lyz2Cre;WT (solid bars) and Lyz2Cre;Traf6flox/flox (mosaic bars) full chimeric mice after PBS/LPS administration at ZT7 (3 hr). (J) Graph represents cumulative survival of Lyz2Cre;WT (blue line) and Lyz2Cre;Traf6flox/flox (orange line) after 10 mg/kg of LPS. (J) Survival curve after 30 mg/kg of b.w. injection in Lyz2Cre;WT (blue line) or Lyz2Cre;Traf6flox/flox (orange line). Values are shown as mean ± SD of two independent experiments with a minimum of three mice or replicates per group and experiment. *p<0.05, **p<0.01.
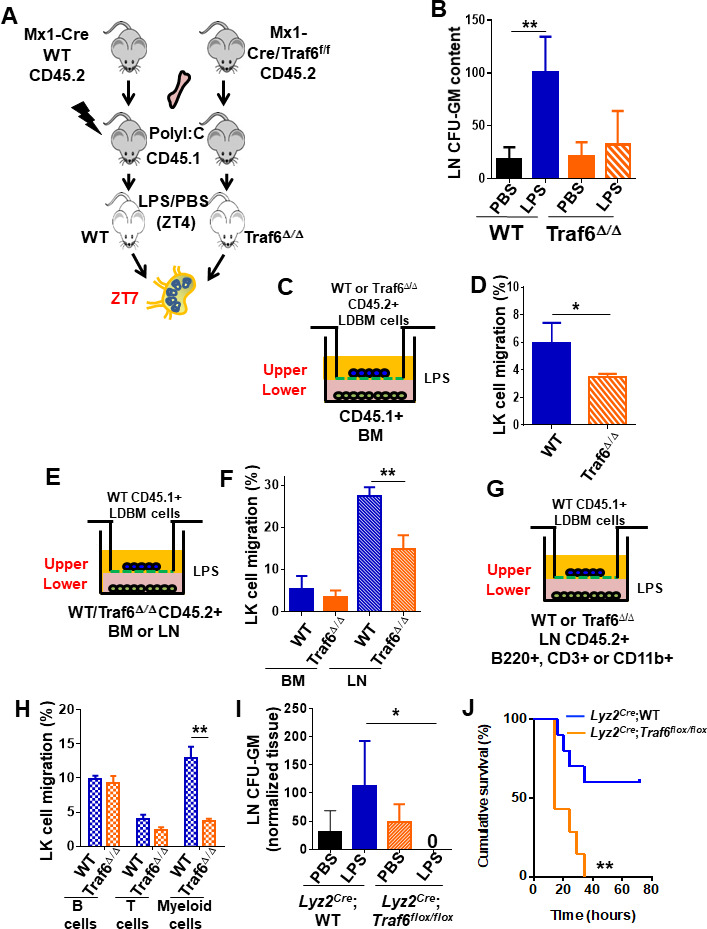
Figure 4.

Figure 4—figure supplement 1. Myeloid progenitor migration to lymph node (LN) in response to lipopolysaccharide (LPS) is independent of NF-κB activation.
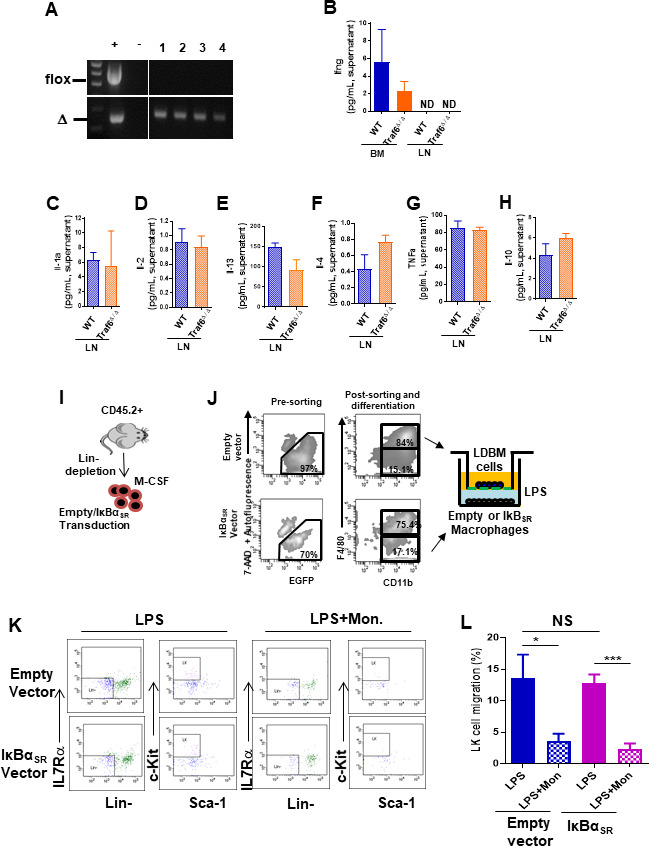
Figure 4—figure supplement 1.

(A) Representative PCR amplifications show Traf6 deleted in circulating cells in four Mx1cre;Traf6flox/flox mice after poly(I:C) injections (10 mg/kg/2 days × five doses). (B) IFN-γ (Ifng) levels in the lower chamber at 4 hr after allowing transwell migration of wild-type (WT) bone marrow (BM) progenitors toward Wt or Traf6-deficient BM or LN cells (from Figure 4E, F). (C–H) Cytokine levels in the lower chamber at 4 hr after allowing transwell migration of LK cell progenitors contained in WT low-density BM (LDBM) toward WT or Traf6-deficient LN cells (from Figure 4E, F). (C) IL1-α (Il-1α). (D) IL-2 (Il-2). (E) IL-13 (Il-13). (F) IL-4 (Il-4). (G) TNF-α (Tnf-α). (H) IL-10 (Il-10). (I–L) Analysis of LK progenitor mitration toward BM-derived macrophages with exogenous expression of IκBα mutant resistant to proteasome degradation. BM Lin- cells were transduced with a MSCV-puro-eGFP bicistronic retroviral vector encoding full length of IκBα mutant and GFP+ protein. EGFP+ Lin- cells were sorted and differentiated in culture by macrophage colony-stimulating factor (M-CSF) cytokine to macrophages. Green fluorescent CD11b+-macrophages were layered on bottom chamber and stimulated them with LPS to generate myeloid chemotaxis gradient. (I) Experimental schema for the analysis of LK (Lin-/c-Kit+/Sca1-) cell migration contained in LDBM from the upper chamber to the transduced macrophage bottom stimulated with LPS and LPS + monensin (LPS + Mon) for 4 hr as depicted in (K). (J) Example of gating strategy for the sorting of transduced macrophages used in the bottom chamber of transwell assays. (K) Representative fluorescence-activated cell sorter dot plots demonstrating gating strategy to identify migrating granulocyte-macrophage progenitor (GMP) populations from the transwell migration assays. (L) Graph represents LK cell migration toward transduced macrophages in the presence of LPS (solid bars) or LPS + Mon (mosaic bars). Values represent mean ± SD of three mice per group and experiment. Experiments were performed per triplicate. ND: not detectable; NS: not significant. *p<0.05, ***p<0.001.
Figure 4—figure supplement 2. Inflammation induces temporal changes in chemokine and cytokine signatures in bone marrow (BM) and lymph node (LN).
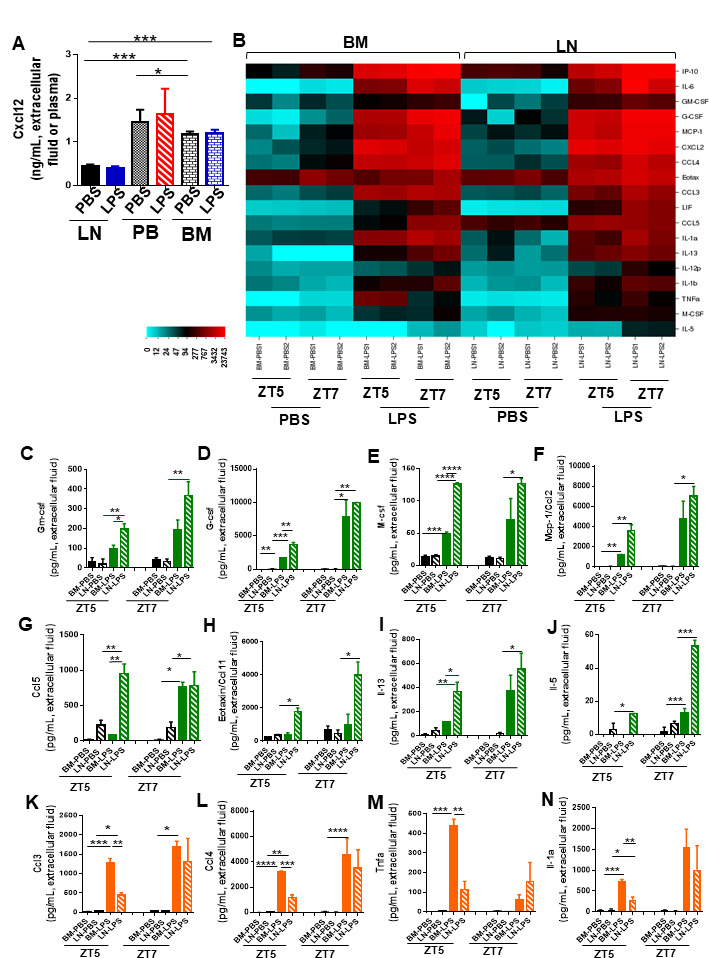
Figure 4—figure supplement 2.

(A) Cxcl12 in femoral or LN extracellular fluid and plasma after PBS/lipopolysaccharide (LPS) in vivo administration at zeitgeber time (ZT)7 (1 pm, 3 hr after LPS administration). (B) Heat map showing cytokine profiling release into the extracellular fluid of femora and LN in response to PBS/LPS at ZT5 (11 am, 1 hr after LPS administration) and ZT7 (1 pm, 3 hr after LPS administration). (C–N) Graphs represent levels of relevant cytokines and chemokines associated with migration/inflammatory response and released into LN extracellular fluid (black and green bars) or into femoral extracellular fluid (black and orange bars) after PBS/LPS administration into C57Bl/6 mice at ZT5 (11 am, 1 hr after LPS administration) and ZT7 (1 pm, 3 hr after LPS administration). (C–J) Extracellular LN levels of Gm-csf (C), G-csf (D), M-Csf (E), Mcp-1 (F), Ccl5 (G), eotaxin/Ccl11 (H), IL-13 (I), and IL-5 (J). (K–N) Extracellular BM levels of Ccl3 (K), Ccl4 (L), Tnfα (M), and IL-1α (N). Values are mean ± SE of two mice per treatment and experiment, pooled from two independent experiments. *p<0.05, **p<0.01, ***p<0.001; ****p<0.0001.