. 2021 Apr 29;10:e67305. doi: 10.7554/eLife.67305

Figure 1. Proximity labelling of CPSF30-sensitive Pol II interactions by mTurbo.

(a) Schematic of the strategy used to tag CPSF30 with the mini auxin-inducible degron (mAID). Guide RNA-expressing Cas9 plasmid and homology-directed repair (HDR) plasmids are shown and the resulting modification to CPSF30 is represented with each inserted element labelled. (b) Western blot demonstrating CPSF30 depletion. Parental HCT116-TIR1, or CPSF30-mAID cells, were treated ±auxin for 3 hr, then blotted. CPSF30 protein is indicated together with a non-specific product, marked by an asterisk, used as a proxy for protein loading. (c) Metagene analysis of 1795 protein-coding genes demonstrating increased downstream transcription, derived from sequencing nuclear RNA, following auxin treatment (3 hr) of CPSF30-mAID cells. TSS = transcription start site, TES = transcription end site (PAS), read-through signal is normalised against gene body. RPKM is reads per kilobase of transcript, per million mapped reads. Positive and negative signals represent sense and antisense reads, respectively. (d) Schematic of our strategy to identify new factors involved in transcription termination. CPSF30-mAID cells were edited to express Rpb1-mTurbo (blue circle on Pol II). The addition of biotin induces mTurbo-mediated biotinylation (orange haze) of factors proximal to Pol II. CPSF complex is shown as an example of what might be captured by this experiment. (e) Western blot showing streptavidin horseradish peroxidase (HRP) probing of extracts from CPSF30-mAID: RPB1-mTurbo cells. Prior treatment with auxin (3 hr)/biotin (10 min) is indicated. The high molecular weight species in the +biotin samples corresponds in size to Rpb1-mTurbo (*). (f) Heat map detailing proteins with the largest decrease in Pol II interaction. Data underpinning heat map are from mass spectrometry analysis of streptavidin sequestered peptides (±CPSF30) performed in triplicate. Labelling was for 10 min.

Figure 1.

Figure 1—figure supplement 1. Validation of the CPSF30 transcriptional read-through defect and of tagging RPB1 with mTurbo.

Figure 1—figure supplement 1.

(a) Integrated genomics viewer (IGV) track views of the transcription termination defect at PCBP1, PSMC2, LSM8, and CAV2 genes in the presence (CPSF30-IAA) or absence of (CPSF30+IAA) CPSF30 in CPSF30-mAID cells. Signal is RPKM. (b) Western blot demonstrating bi-allelic modification of RPB1 (Pol II) with mTurbo. The clone employed in Figure 1 is shown against parental HCT116 cells, unmodified at RBP1. The upshift of Pol II signal shows the bi-allelic modification of RPB1. EXOSC10 serves as a loading control. (c) Quantitative reverse transcription and PCR (qRT-PCR) of total RNA isolated from CPSF30-mAID: RPB1- mTurbo cells treated or not with auxin (3 hr). An amplicon located ~10 kb downstream of the HMGA2 PAS was used to assay transcriptional read-through presented as a fold change versus minus auxin after normalising to spliced actin mRNA. n = 2. Individual data points are shown. RPKM = reads per kilobase of transcript, per million mapped reads.
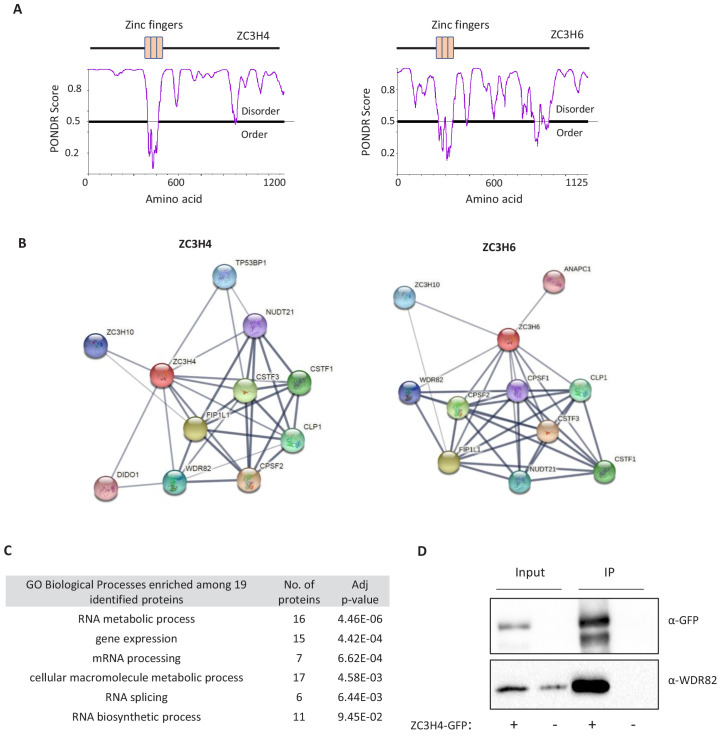
Figure 1—figure supplement 2. Predicted structures and interactors of ZC3H4 and ZC3H6.

Figure 1—figure supplement 2.

(a) Schematic of ZC3H4 and ZC3H6 showing the three CCCH zinc finger domains. A predictor of natural disordered region (PONDR) analysis shows that the only ordered region of ZC3H4 coincides with these domains. Graph generated via PONDR.com, set to VSL2. (b) STRING analysis of ZC3H4 and ZC3H6 indicates interactors with 3’ end processing complex members. Image was taken from string.db.org, confidence value was set to medium (0.4). The thickness of lines between nodes is indicative of the confidence in interaction. (c) Proteins that are co-regulated with ZC3H4 according to ProteomeHD (https://www.proteomehd.net/) using a score cut-off set to 0.998. Table shows Gene Ontology (GO) term analysis of the potentially co-regulated factors. (d) Co-immunoprecipitation of WDR82 using ZC3H4-GFP as bait. Blot shows input (5%) and immunoprecpitated material probed with antibodies to WDR82 or GFP. Cells untransfected with ZC3H4-GFP act as a negative control.
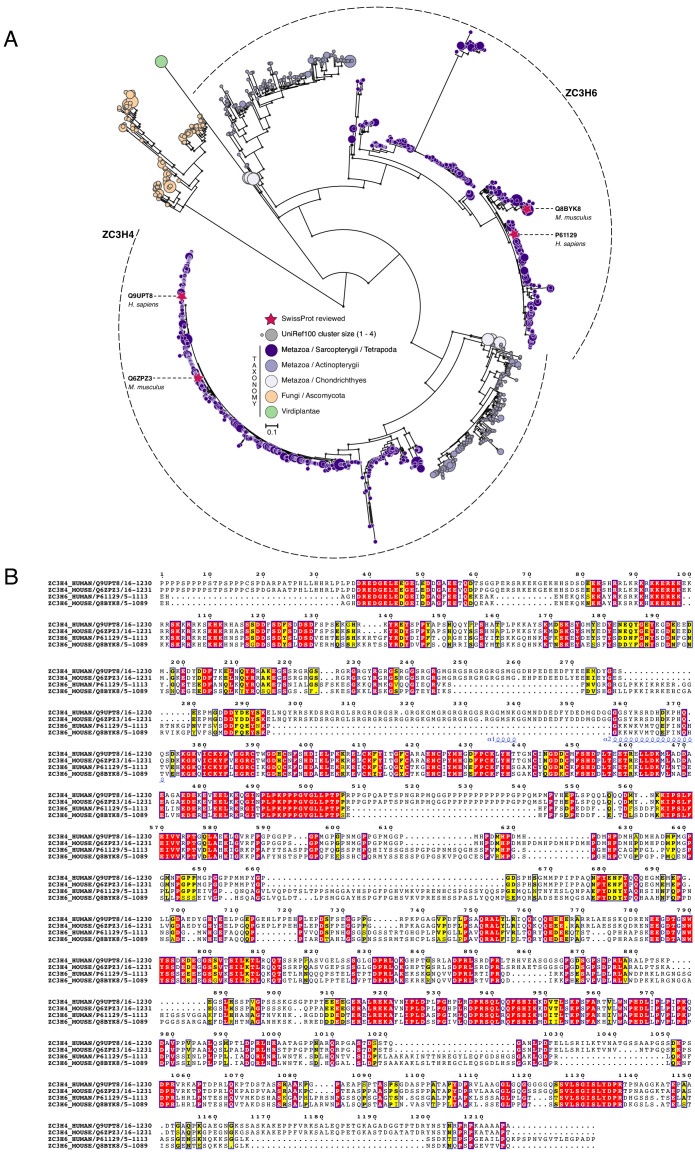
Figure 1—figure supplement 3. Phylogenetic analysis of ZC3H4 and ZC3H6.

Figure 1—figure supplement 3.

(a) Maximum-likelihood phylogenetic tree of zinc finger CCCH-domains (1513 sequences; 795 parsimony informative sites) inferred under the JTT + R8 model. Clades of ZC3H4-like and ZC3H6-like domains are delimited by dashed lines. CCCH-domains identified using the PANTHER hidden Markov model PTHR13119 against the UniProtKB protein database (non-redundant version: UniRef100; external node size represents protein cluster size). Branch support values ≥90% (based on 1000 ultrafast bootstraps) are indicated by grey circles. Red stars show SwissProt reviewed protein sequences; external nodes are colour-coded according to their taxonomic lineage. Scale bar represents the number of estimated substitutions per site. Virtually all recovered sequences were from metazoan organisms – except for a group of fungal sequences from ascomycetes. The resulting phylogenetic tree shows the dichotomy between the ZC3H4 and ZC3H6 domains, which are found in the same set of organisms. This indicates that they are paralogues and have likely diverged their function following gene duplication. The ancestral gene coding for ZC3H4/6 was likely lost from the non-vertebrates and subsequently underwent a duplication event leading to the ZC3H4- and ZC3H6-like paralogues in vertebrates. Primary data are available in Supplementary file 2 and deposited at Zenodo (https://doi.org/10.5281/zenodo.4637127). (b) Multiple sequence alignment of ZC3H4 and ZC3H6 homologues. PTHR13119 domains from human and mouse SwissProt sequences were aligned using structural information (PDB structure: 2CQE; zinc finger domain; helices are displayed as coils) using TCoffee (Expresso mode). Conserved regions are indicated by blue boxes; identical and similar residues (based on physicochemical properties) are marked in red and yellow, respectively. Sequence identifiers correspond to UniProt/SwissProt accession numbers and to boundaries of identified PTHR13119 domains. Alignment figure was rendered with ESPscript.