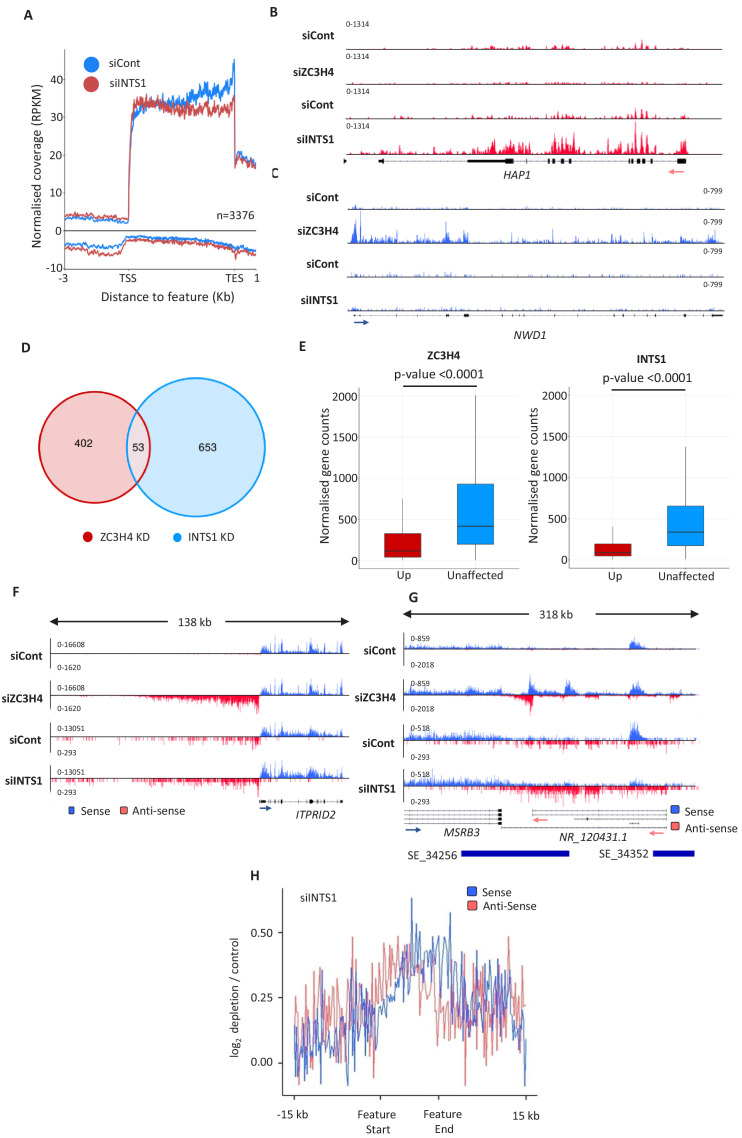
Figure 3. Comparison of ZC3H4 and Integrator effects.
(a) Metagene analysis of chromatin-associated RNA-seq performed on cells treated with control or INTS1-specific siRNA. The plot shows signals upstream, across, and downstream of protein-coding genes. Y-axis scale is RPKM. Positive and negative values represent sense and antisense reads, respectively. (b, c) IGV traces of HAP1 and NWD1 genes derived from chromatin-associated RNA-seq in control and INTS1 siRNA treated samples and nuclear RNA-seq from control or ZC3H4 siRNA treatment. NWD1 transcripts are affected by ZC3H4 but not INTS1, whereas the opposite is true for HAP1 RNAs. Y-axes scales are RPKM. (d) Venn diagram showing the number of mRNAs upregulated ≥2-fold, padj ≤0.05 following ZC3H4 depletion versus INTS1 loss and the overlap between the two sets. Genes that showed increased expression due to transcription read-through from an upstream gene were filtered by assessing coverage over a 1 kb region preceding the TSS, relative to untreated cells. (e) Graphs demonstrating the expression level of mRNA transcripts upregulated (log2FC >1) following ZC3H4 or INTS1 depletion by comparison with transcripts unaffected by loss of either factor. Y-axis shows normalised gene counts (i.e. expression level). (f) Comparison of chromatin-associated RNA-seq in control and INTS1 siRNA treated samples with nuclear RNA-seq derived from control or ZC3H4 siRNA treatment. The ITPRID2 PROMPT is displayed and y-axes are RPKM (note the different scales between ZC3H4 and INTS1 samples). (g) Comparison of chromatin-associated RNA-seq in control and INTS1 siRNA treated samples with nuclear RNA-seq derived from control or ZC3H4 siRNA treatment. The MSRB3 SE is displayed and y-axes are RPKM (note the different scales between INTS1 and ZC3H4 samples). (h) Metaplot of RNA-seq profile over super-enhancers following INTS1 depletion (log2 fold depletion/control over 111 super-enhancer as line graphs). The bed file detailing super-enhancer coordinates in HCT116 cells was taken from dbSUPER.org. RPKM = reads per kilobase of transcript, per million mapped reads, TSS = transcription start site.


