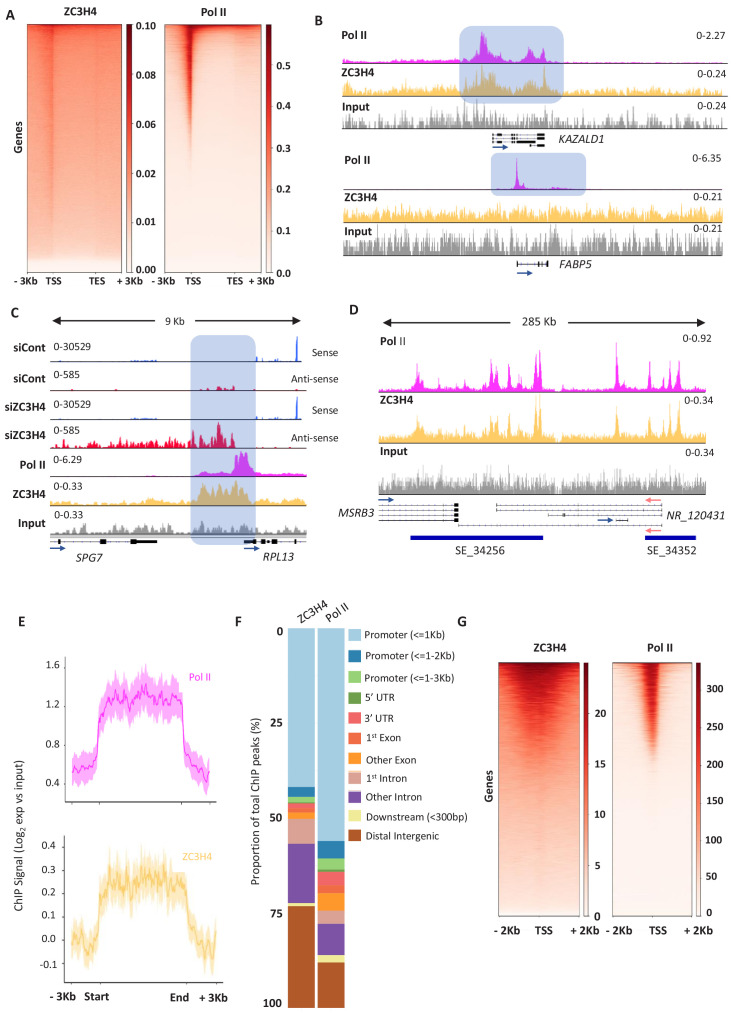
Figure 5. ZC3H4 occupies regions where transcription is affected by its absence.
(a) ZC3H4 ChIP profile over protein-coding genes is similar to Pol II. Heat map representation of ZC3H4 and Pol II ChIP-seq occupancy over the gene body ±3 kb. (b) ZC3H4 occupies fewer promoters than Pol II. IGV track view of ZC3H4 and Pol II occupancy over KAZALD1 and FABP5 genes, Pol II is present at both genes, while ZC3H4 is only present at KAZALD1. Scale is counts per million (CPM). Shaded blue box shows peak of Pol II and ZC3H4 at KAZALD1 and of Pol II over FABP5. (c) RNA-seq (HCT116 cells treated with control or ZC3H4 siRNA) and ChIP-seq (Pol II, ZC3H4 and input) profiles at RPL13. ZC3H4 occupancy is focused more on the PROMPT transcript region (blue box) than the TSS where, in contrast, the Pol II signal is maximal. RNA-seq scale is RPKM and ChIP-seq is CPM. (d) ZC3H4 ChIP occupancy mirrors Pol II at super-enhancers. IGV track view of ZC3H4 and Pol II occupancy over the SE at the MSRB3 locus. HCT116 super-enhancer gene track is from dbSUPER and depicted as blue bars. (e) Log2 fold change of ZC3H4 and Pol II vs. input at SEs shown as a line graph. Halo denotes 95% confidence level. (f) ChIPseeker analysis of peak distribution of ZC3H4 and Pol II. Occupancy regions are colour-coded and the number of ChIP peaks expressed as a proportion of 100%. (g) Heat map showing Pol II and ZC3H4 ChIP occupancy in HEPG2 cells obtained via the ENCODE consortium. Occupancy ±2 kb of the TSS is shown. RPKM = reads per kilobase of transcript, per million mapped reads, ChIP-seq = chromatin immunoprecipitation and sequencing, CPM = counts per million, TSS = transcription start site.


