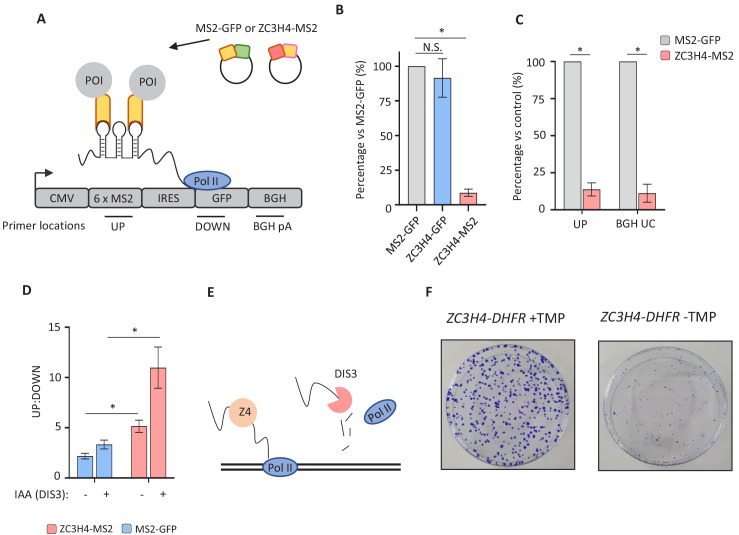
Figure 6. Directed recruitment of ZC3H4 recapitulates its effects on endogenous targets.
(a) Schematic of the MS2 system. A reporter plasmid (MS2hp-IRES-GFP) expressing a GFP transcript with 6 x MS2 hairpins upstream of an IRES and GFP gene. ZC3H4-MS2 or MS2-GFP can be specifically tethered to the MS2 hairpins to assess consequent effects on transcription/RNA output. Positions of primer pairs used in qRT-PCR experiments elsewhere in the figure are indicated by labelled horizontal lines under reporter. POI is protein of interest. (b) qRT-PCR analysis of total RNA isolated from MS2hp-IRES-GFP transfected cells co-transfected with MS2-GFP, ZC3H4-GFP, or ZC3H4-MS2. The level of reporter RNA is plotted (‘UP’ amplicon) as a percentage of that obtained in the MS2-GFP sample following normalisation to spliced actin. N = 3. Error bars are SEM. * denotes p<0.05. (c) qRT-PCR analysis of chromatin-associated RNA isolated from MS2hp-IRES-GFP transfected cells co-transfected with either MS2-GFP or ZC3H4-MS2. The level of reporter RNA upstream of the MS2 hairpins (UP) and transcripts yet to be cleaved at the BGH poly(A) site (BGH UC) are plotted as a percentage of that obtained in the MS2-GFP sample following normalisation to spliced actin. N = 3. Error bars are SEM. * denotes p<0.05. (d) qRT-PCR analysis of total RNA isolated from MS2hp-IRES-GFP transfected DIS3-AID cells co-transfected with either MS2-GFP or ZC3H4-MS2 – simultaneously treated or not with auxin to deplete DIS3 (14 hr in total). The graph shows the ratio of RNA species recovered upstream (UP) versus downstream (DOWN) of the MS2 hairpins. N = 4. Error bars are SEM. * denotes p<0.05. (e) Schematic detailing an interplay between ZC3H4 and DIS3 that sees transcription stop and nascent RNA degraded (f) Colony formation assay of ZC3H4-DHFR cells grown in the presence or absence of TMP. Cells were grown for 10 days before crystal violet staining.
Figure 6—figure supplement 1. Control experiments for the specificity of ZC3H4 tethering effects.


