. 2021 Apr 27;10:e67291. doi: 10.7554/eLife.67291

Figure 5. Co-registration and comparison of the spatial distributions of vibrissa, genioglossus, and masseter premotor circuits in Allen common coordinate framework (CCF).

(A) Procedure for mapping orofacial premotor neurons to Allen CCF. (B) Reconstructed representative vibrissa (magenta), masseter (gold), and genioglossus (cyan) premotor circuits in Allen CCF (top). Merged image (bottom). (C) Cross-correlation analysis of the spatial distribution patterns of individual animals; vibrissa (v1–v4; four mice), masseter (m1–m4; four mice), and genioglossus (g1–g4; four mice) premotor circuits. (D) Two-dimensional contour density analysis of representative vibrissa (magenta), masseter (yellow), and genioglossus (blue) premotor circuits.

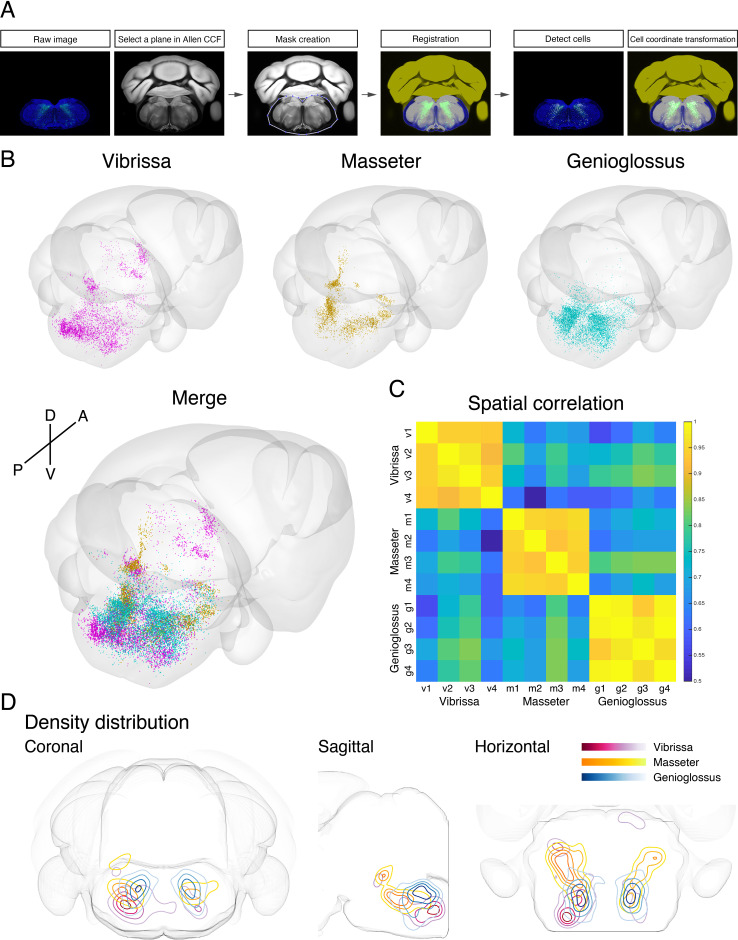
Figure 5—source data 1. Coordinates of all labeled premotor neurons.
Vibrissa premotor neurons from four mice (v1, v2, v3, v4), genioglossus premotor neurons from four mice (g1, g2, g3, g4), and masseter premotor neurons from four mice (m1, m2, m3, m4). Coordinates are relative to Bregma (in millimeters). Those coordinates can be converted into Allen common coordinate framework (CCF) coordinates by the following equations: AP in CCF = –1 × AP coordinates × 1000 + 5400; DV in CCF = DV coordinates × 1000; ML in CCF = ML coordinates × 1000 + 5700.
Figure 5—source data 2. Coordinates of all starter cells.
Vibrissa starter cells from four mice (VII_v1, VII_v2, VII_v3, VII_v4), genioglossus starter cells from four mice (XII_g1, XII_g2, XII_g3, XII_g4), and masseter starter cells from four mice (V_m1, V_m2, V_m3, V_m4). Coordinates are relative to Bregma (in millimeters). Those coordinates can be converted into Allen common coordinate framework (CCF) coordinates by the following equations: AP in CCF = –1 × AP coordinates × 1000 + 5400; DV in CCF = DV coordinates × 1000; ML in CCF = ML coordinates × 1000 + 5700.

Figure 5.

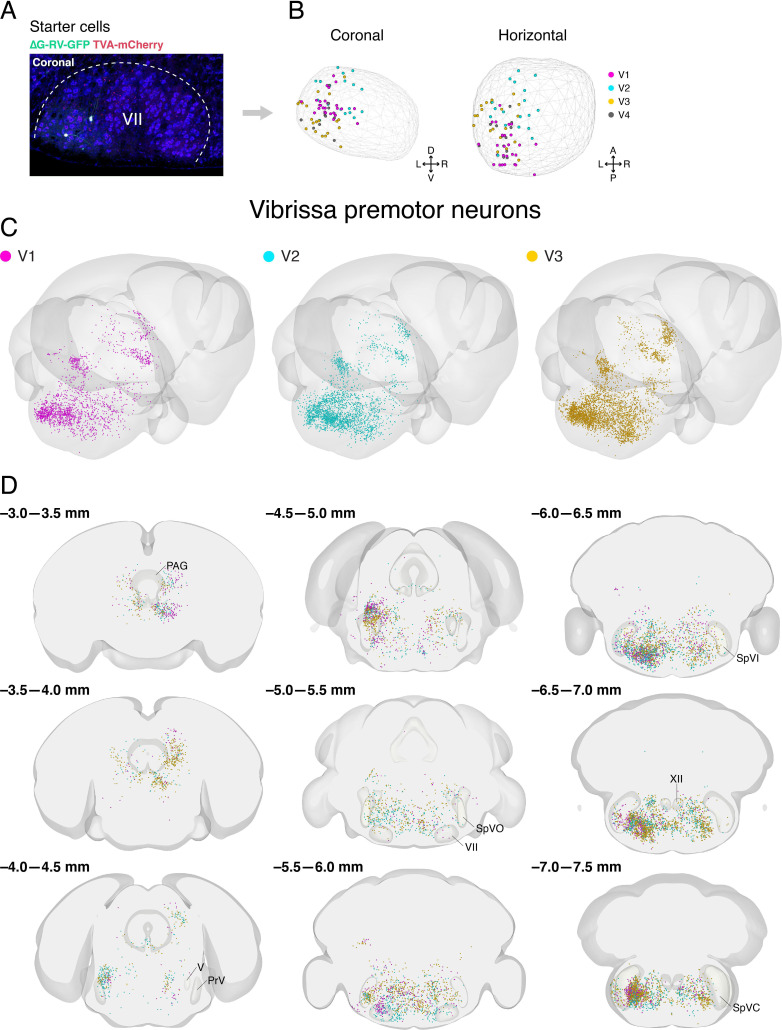
Figure 5—figure supplement 1. Distribution of starter cells in the facial motor nucleus and labeled vibrissa premotor neurons from individual animals in Allen mouse brain common coordinate framework.

Figure 5—figure supplement 1.

(A) A representative image of starter cells in the facial motor nucleus (VII) that co-express TVA-mCherry (red) and GFP (green) from ∆G-RV-GFP. (B) Reconstructed locations of starter cells in VII projected onto coronal (left) and horizontal (right) planes. The contour of VII is shown by the wireframe. (C) Three-dimensional reconstruction of labeled vibrissa premotor neurons with posterior oblique view from three different mice (V1, magenta; V2, cyan; V3, gold). (D) Coronal views of reconstructed vibrissa premotor neurons from all three mice in the same coordinates. Anterior-posterior levels (referenced to Bregma) are shown on the top left of each panel.
Figure 5—figure supplement 2. Distribution of starter cells in the hypoglossal nucleus and labeled genioglossus premotor neurons from individual animals in Allen mouse brain common coordinate framework.

Figure 5—figure supplement 2.

(A) A representative image of starter cells in the hypoglossal nucleus (XII) that co-express TVA-mCherry (red) and GFP (green) from ∆G-RV-GFP. (B) Reconstructed locations of starter cells in XII projected onto coronal (left) and horizontal (right) planes. The contour of XII is shown by the wireframe. (C) Three-dimensional reconstruction of labeled genioglossus premotor neurons with the posterior oblique view from three different mice (G1, magenta; G2, cyan; G3, gold). (D) Coronal views of reconstructed genioglossus premotor neurons from all three mice in the same coordinates. Anterior-posterior levels (referenced to Bregma) are shown on the top left of each panel.
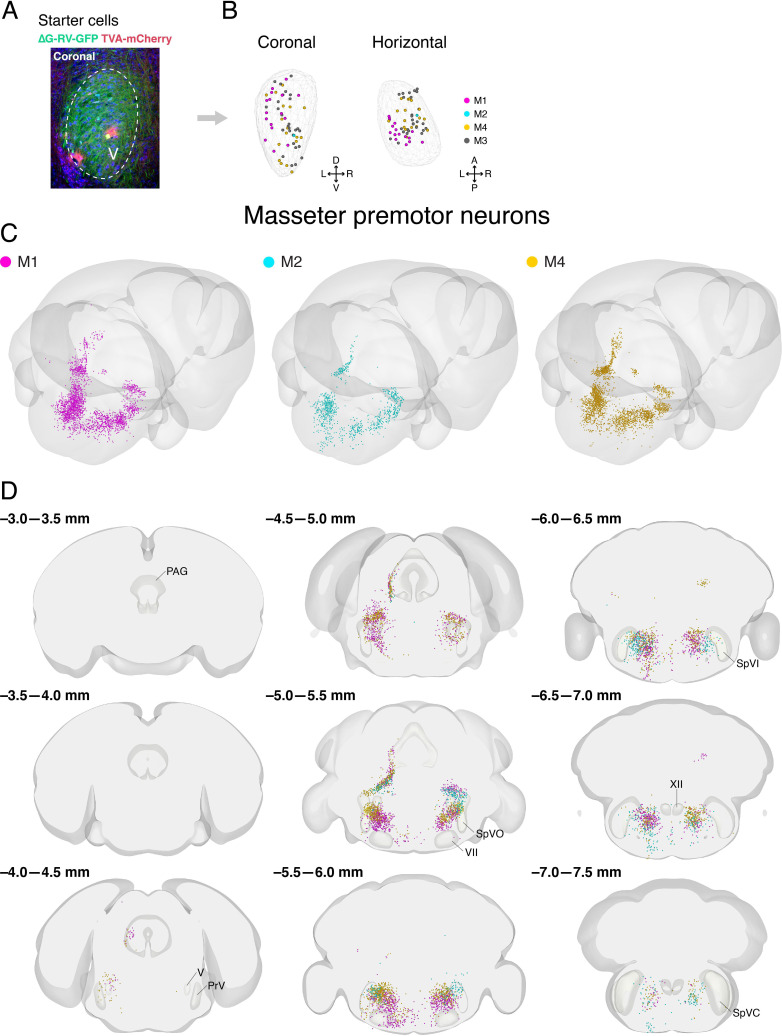
Figure 5—figure supplement 3. Distribution of starter cells in the trigeminal motor nucleus and labeled masseter premotor neurons from individual animals in Allen mouse brain common coordinate framework.

Figure 5—figure supplement 3.

(A) A representative image of starter cells in the trigeminal motor nucleus (V) that co-express TVA-mCherry (red) and GFP (green) from ∆G-RV-GFP. (B) Reconstructed locations of starter cells in V projected onto coronal (left) and horizontal (right) planes. The contour of V is shown by the wireframe. (C) Three-dimensional reconstruction of labeled masseter premotor neuron with the posterior oblique view from three different mice (M1, magenta; M2, cyan; M3, gold). (D) Coronal views of reconstructed masseter premotor neurons from all three mice in the same coordinates. Anterior-posterior levels (referenced to Bregma) are shown on the top left of each panel.
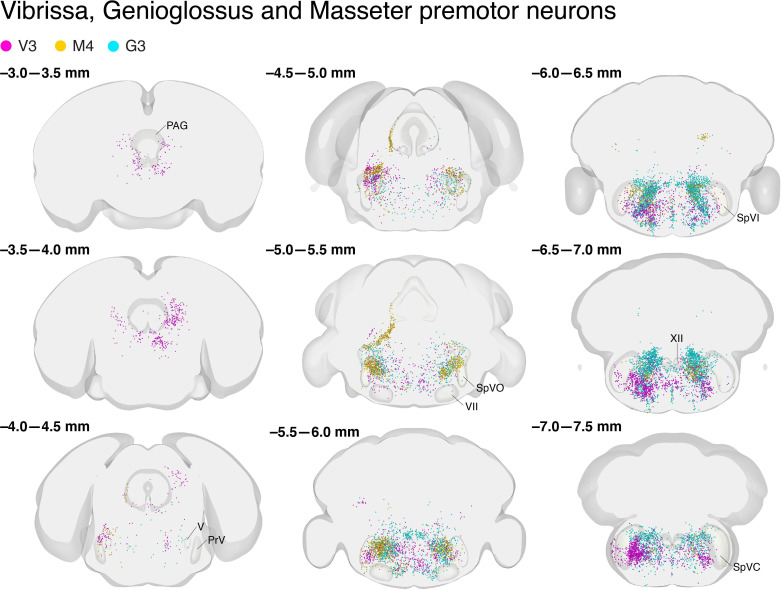
Figure 5—figure supplement 4. Vibrissa, genioglossus, and masseter premotor neurons overlapped with respect to the Allen mouse brain common coordinate framework.

Figure 5—figure supplement 4.

Coronal views of reconstructed vibrissa (magenta), genioglossus (cyan), and masseter (gold) premotor neurons. Anterior-posterior levels (referenced to Bregma) are shown on the top left of each panel. The identification numbers of animals are shown on top.
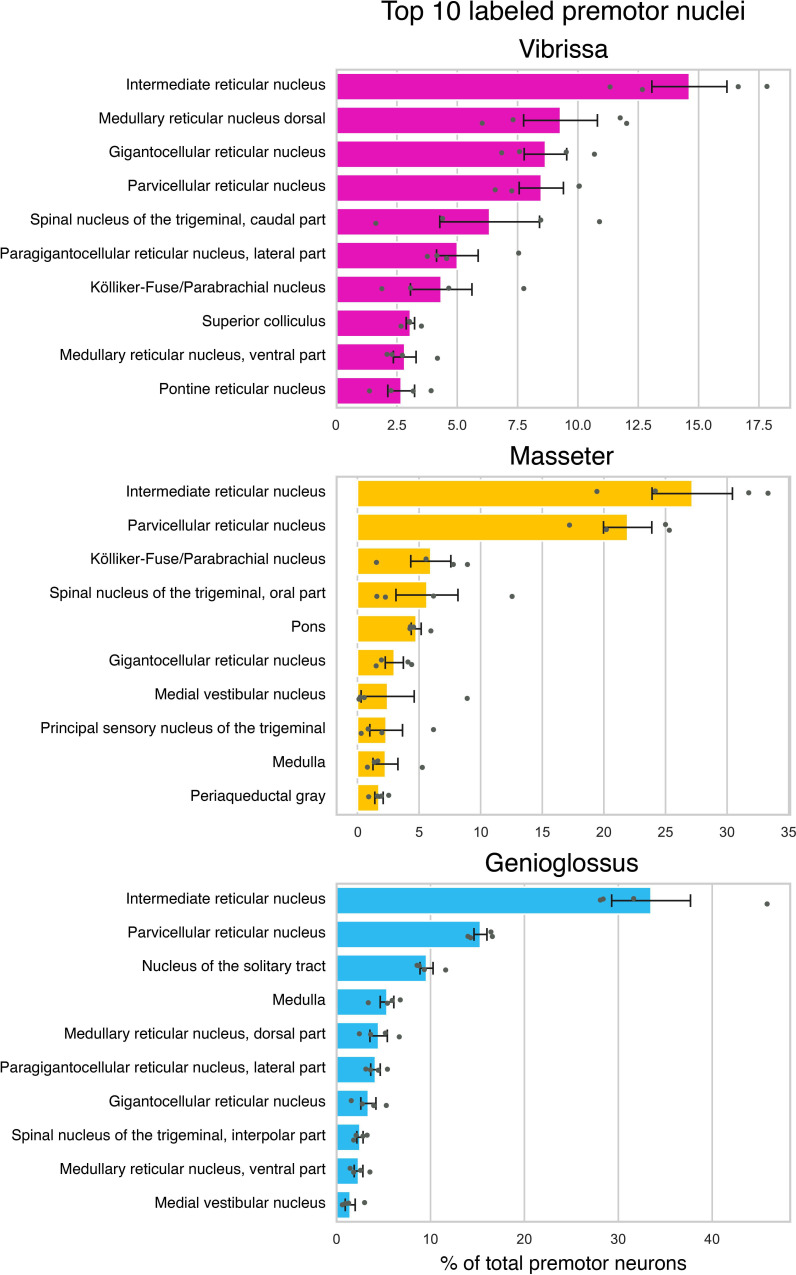
Figure 5—figure supplement 5. Quantification of transsynaptically labeled neurons in top 10 labeled brain areas for each motor group based on Allen mouse brain common coordinate framework (CCF) nomenclature.

Figure 5—figure supplement 5.

Summary of the distributions of vibrissa (top, magenta, four mice), masseter (middle, gold, four mice), and genioglossus (bottom, cyan, four mice) premotor neurons. Brain areas were automatically annotated based on Allen CCF coordinates. The value is normalized against the total numbers of labeled neurons and averaged across animals. Data are mean ± SEM (n = 4).
Figure 5—video 1. Three-dimensional reconstructed vibrissa (magenta), genioglossus (cyan), and masseter (gold) premotor circuits.
Download video file (5.1MB, mp4)