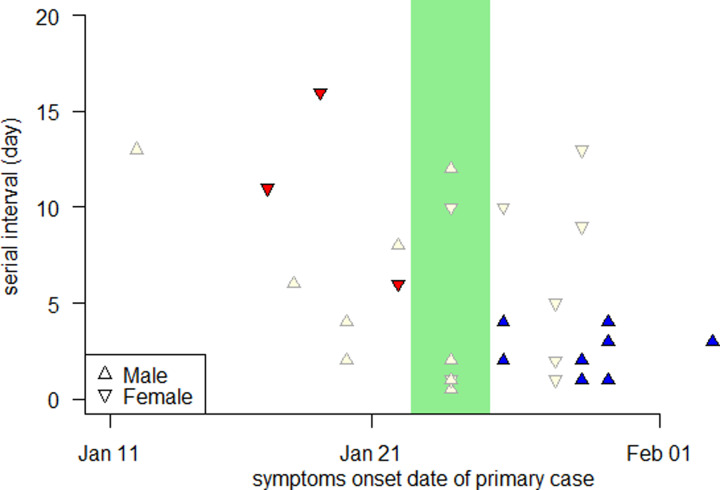
Fig. 3.
SIs of the COVID-19 transmission pairs in Shenzhen and Hong Kong, China, during the early outbreaks. The SI with male or female primary case is represented by upward or downward triangle, respectively. The hollow or filled (red for female and blue for male) triangle represents the SI data excluded or included in the t tests, respectively. The green shading area highlights the CLNY.

