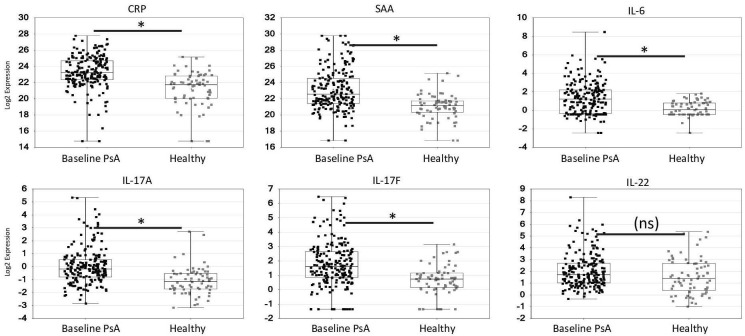
Figure 1.
Baseline levels of acute phase reactants (A–C) and IL-23/Th17 effector cytokines (D–F) in patients with PsA in DISCOVER studies compared with matched healthy controls. Concentration (log2) of analyte (indicated at top of plots) for PsA patients (baseline) and healthy controls. Data presented as symbols representing individual participants and summarised by box plots. Each box represents the upper and lower IQR; lines inside the boxes represent the median; and whiskers represent the range. *Generalised linear model p<0.05 and absolute value of fold difference ≥1.4 vs healthy controls. CRP, C reactive protein; IL, interleukin; PsA, psoriatic arthritis; SAA, serum amyloid A; Th17, T-helper cell 17.

