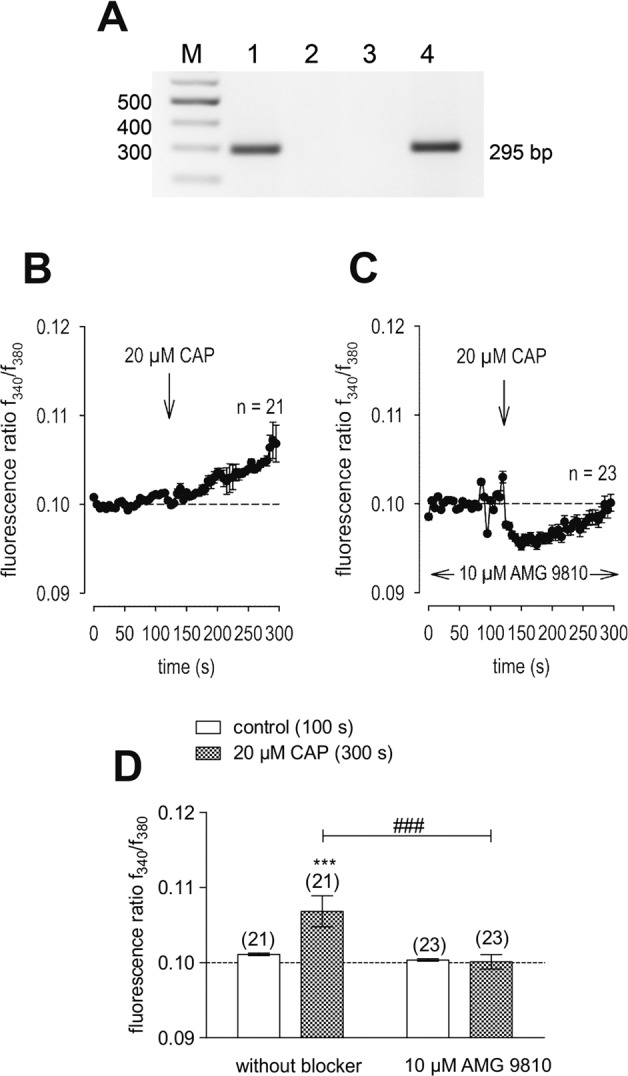
Fig. 1. TRPV1 gene and functional expression in HCK.

A RT-PCR analysis of TRPV1 expression using gene specific primers revealed TRPV1 in HCK (lane 1) and HCEC-12 (positive control, lane 4). Template-free negative controls (lane 2: template replaced with H2O, lane 3: w/o reverse transcriptase in the reverse transcription reaction) gave no bands. M = 100 bp plus DNA ladder. B 20 µmol/l CAP induced an increase in Ca2+ influx (n = 21) in HCK. C Same experiment as shown in B, but in the presence of AMG 9810. AMG 9810 (10 µmol/l) clearly suppressed the CAP-induced Ca2+ increase even partially below the base line level (n = 23). D Summary of the experiments with CAP and AMG 9810 in HCK. The asterisks (*) designate significant increases in [Ca2+]i with CAP (t = 300 s; n = 21; p < 0.005; paired tested) compared to control (t = 100 s). The hashtags (#) indicate statistically significant differences in fluorescence ratios between CAP with and without AMG 9810 (t = 300 s; n = 21–23; p < 0.005; nonpaired tested).
