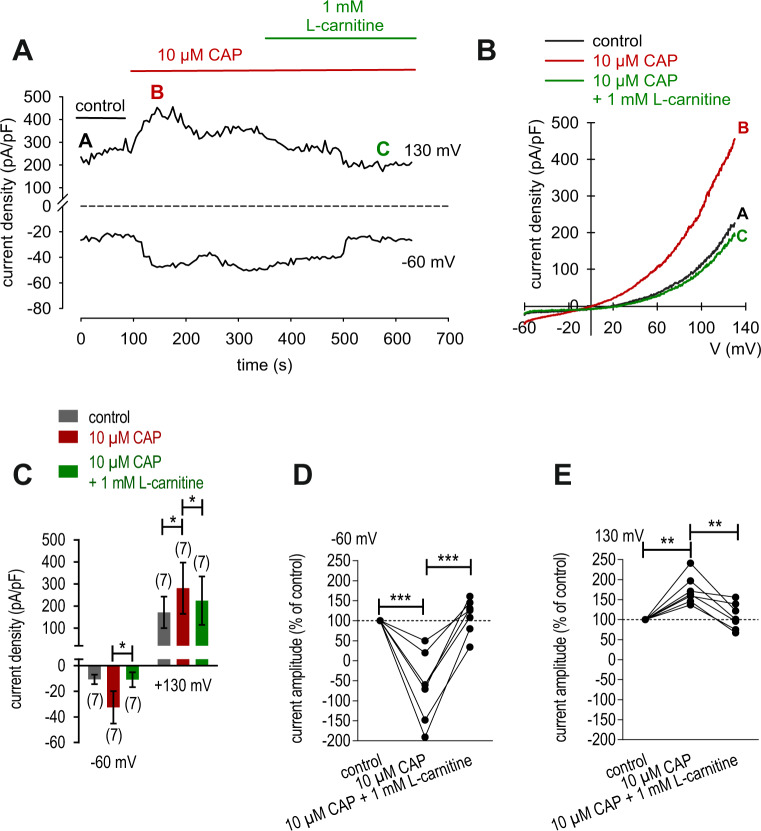
Fig. 2. L-carnitine suppressed CAP-induced increases of whole-cell currents in HCK.
A Time course recording of the current increases induced by CAP (10 µmol/l) and declined after application of 1 mmol/l L-carnitine. B Original traces of CAP-induced current responses to voltage ramps. Current densities are shown before application (labeled as A), during application of 10 µmol/l CAP (labeled as B) and after addition of 1 mmol/l L-carnitine (labeled as C). Calculated current densities obtained by normalizing currents to membrane capacitance as function of imposed voltage were derived from the traces shown in A. C Summary of patch-clamp experiments with CAP and L-carnitine. The asterisks (*) indicate statistically significant differences of whole-cell currents with and without CAP (n = 7; p < 0.05; paired tested) and significant difference of CAP-induced increased with and without L-carnitine (n = 7; p < 0.05; paired tested). D Maximal negative current amplitudes induced by a voltage step from 0 to −60 mV are depicted in percent of control values before application of 10 l/l CAP (control set to 100%). CAP-induced inward currents could be clearly suppressed in the presence of 1 mmol/l L-carnitine. E Same diagram but related to maximal positive current amplitudes induced by a voltage step from 0 to +130 mV.

