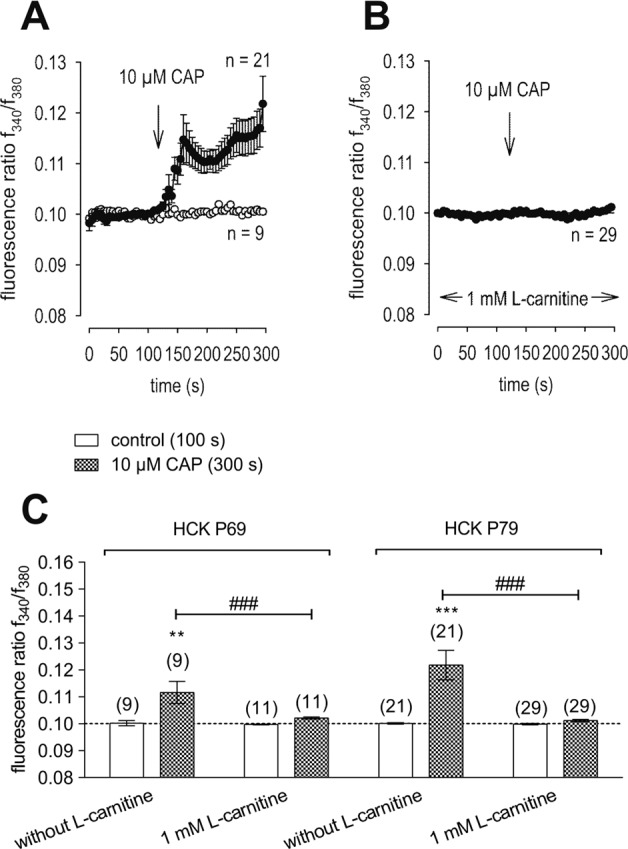
Fig. 3. L-carnitine suppressed CAP-induced increases of intracellular Ca2+ concentration.

A 10 µmol/l CAP induced an increase in Ca2+ influx (n = 21) in HCK (P79) whereas non-treated control cells maintained a constant Ca2+ baseline (n = 9). B Same experiment as shown in A, but in the presence of L-carnitine (HCK P79). L-carnitine (1 mmol/l) clearly suppressed the CAP-induced Ca2+ increase (n = 29). C Summary of the experiments with CAP and L-carnitine in HCK from two different cell passages (P69, P79). The asterisks (*) designate significant increases in [Ca2+]i with CAP (t = 300 s; n = 9–21; p < 0.01 at the minimum; paired tested) compared to control (t = 100 s). The hashtags (#) indicate statistically significant differences in fluorescence ratios between CAP with and without L-carnitine (t = 300 s; n = 9–29; p < 0.005; non-paired tested).
