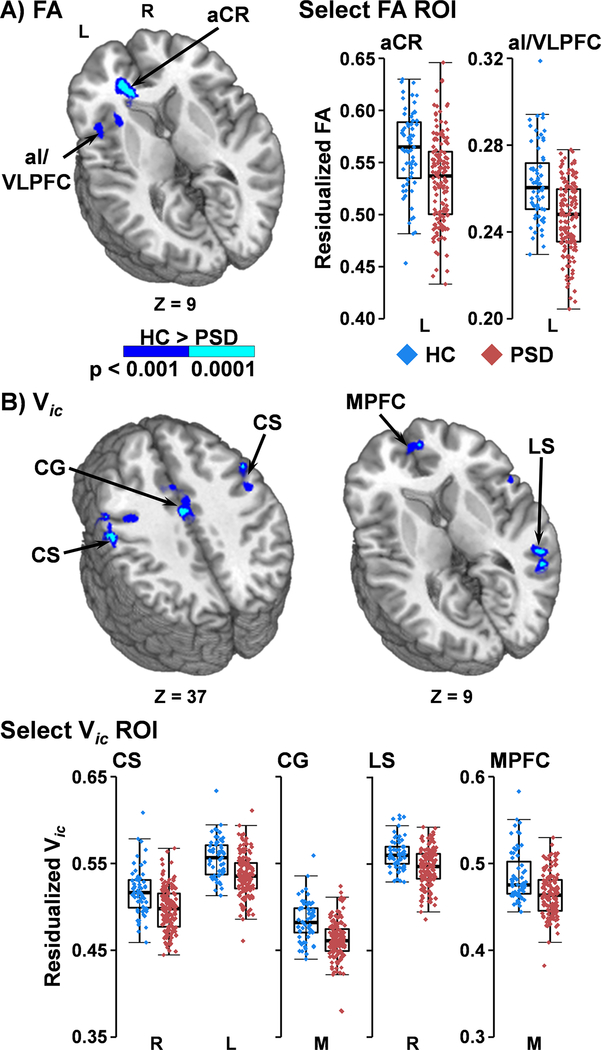
Figure 3. Fractional Anisotropy (FA) and Intracellular Neurite Density (Vic):
Main effect of Group for greater FA (Panel A) and Vic volume (Panel B; dark blue: p<0.001; cyan: p<0.0001) for healthy controls (HC) relative to patients with psychotic spectrum disorders (PSD). Depicted regions include medial prefrontal cortex (MPFC), cingulate gyrus (CG), central sulcus (CS), anterior insular/ventrolateral prefrontal cortex (aI/VLPFC), anterior coronal radiata (aCR), and temporal cortex along the lateral sulcus (LS) within the left (L) or right (R) hemisphere. Axial (Z) slice coordinates are given according to the Talairach atlas. Box-and-scatter plots are displayed for select regions of interest for PSD (red) versus HC (blue).

