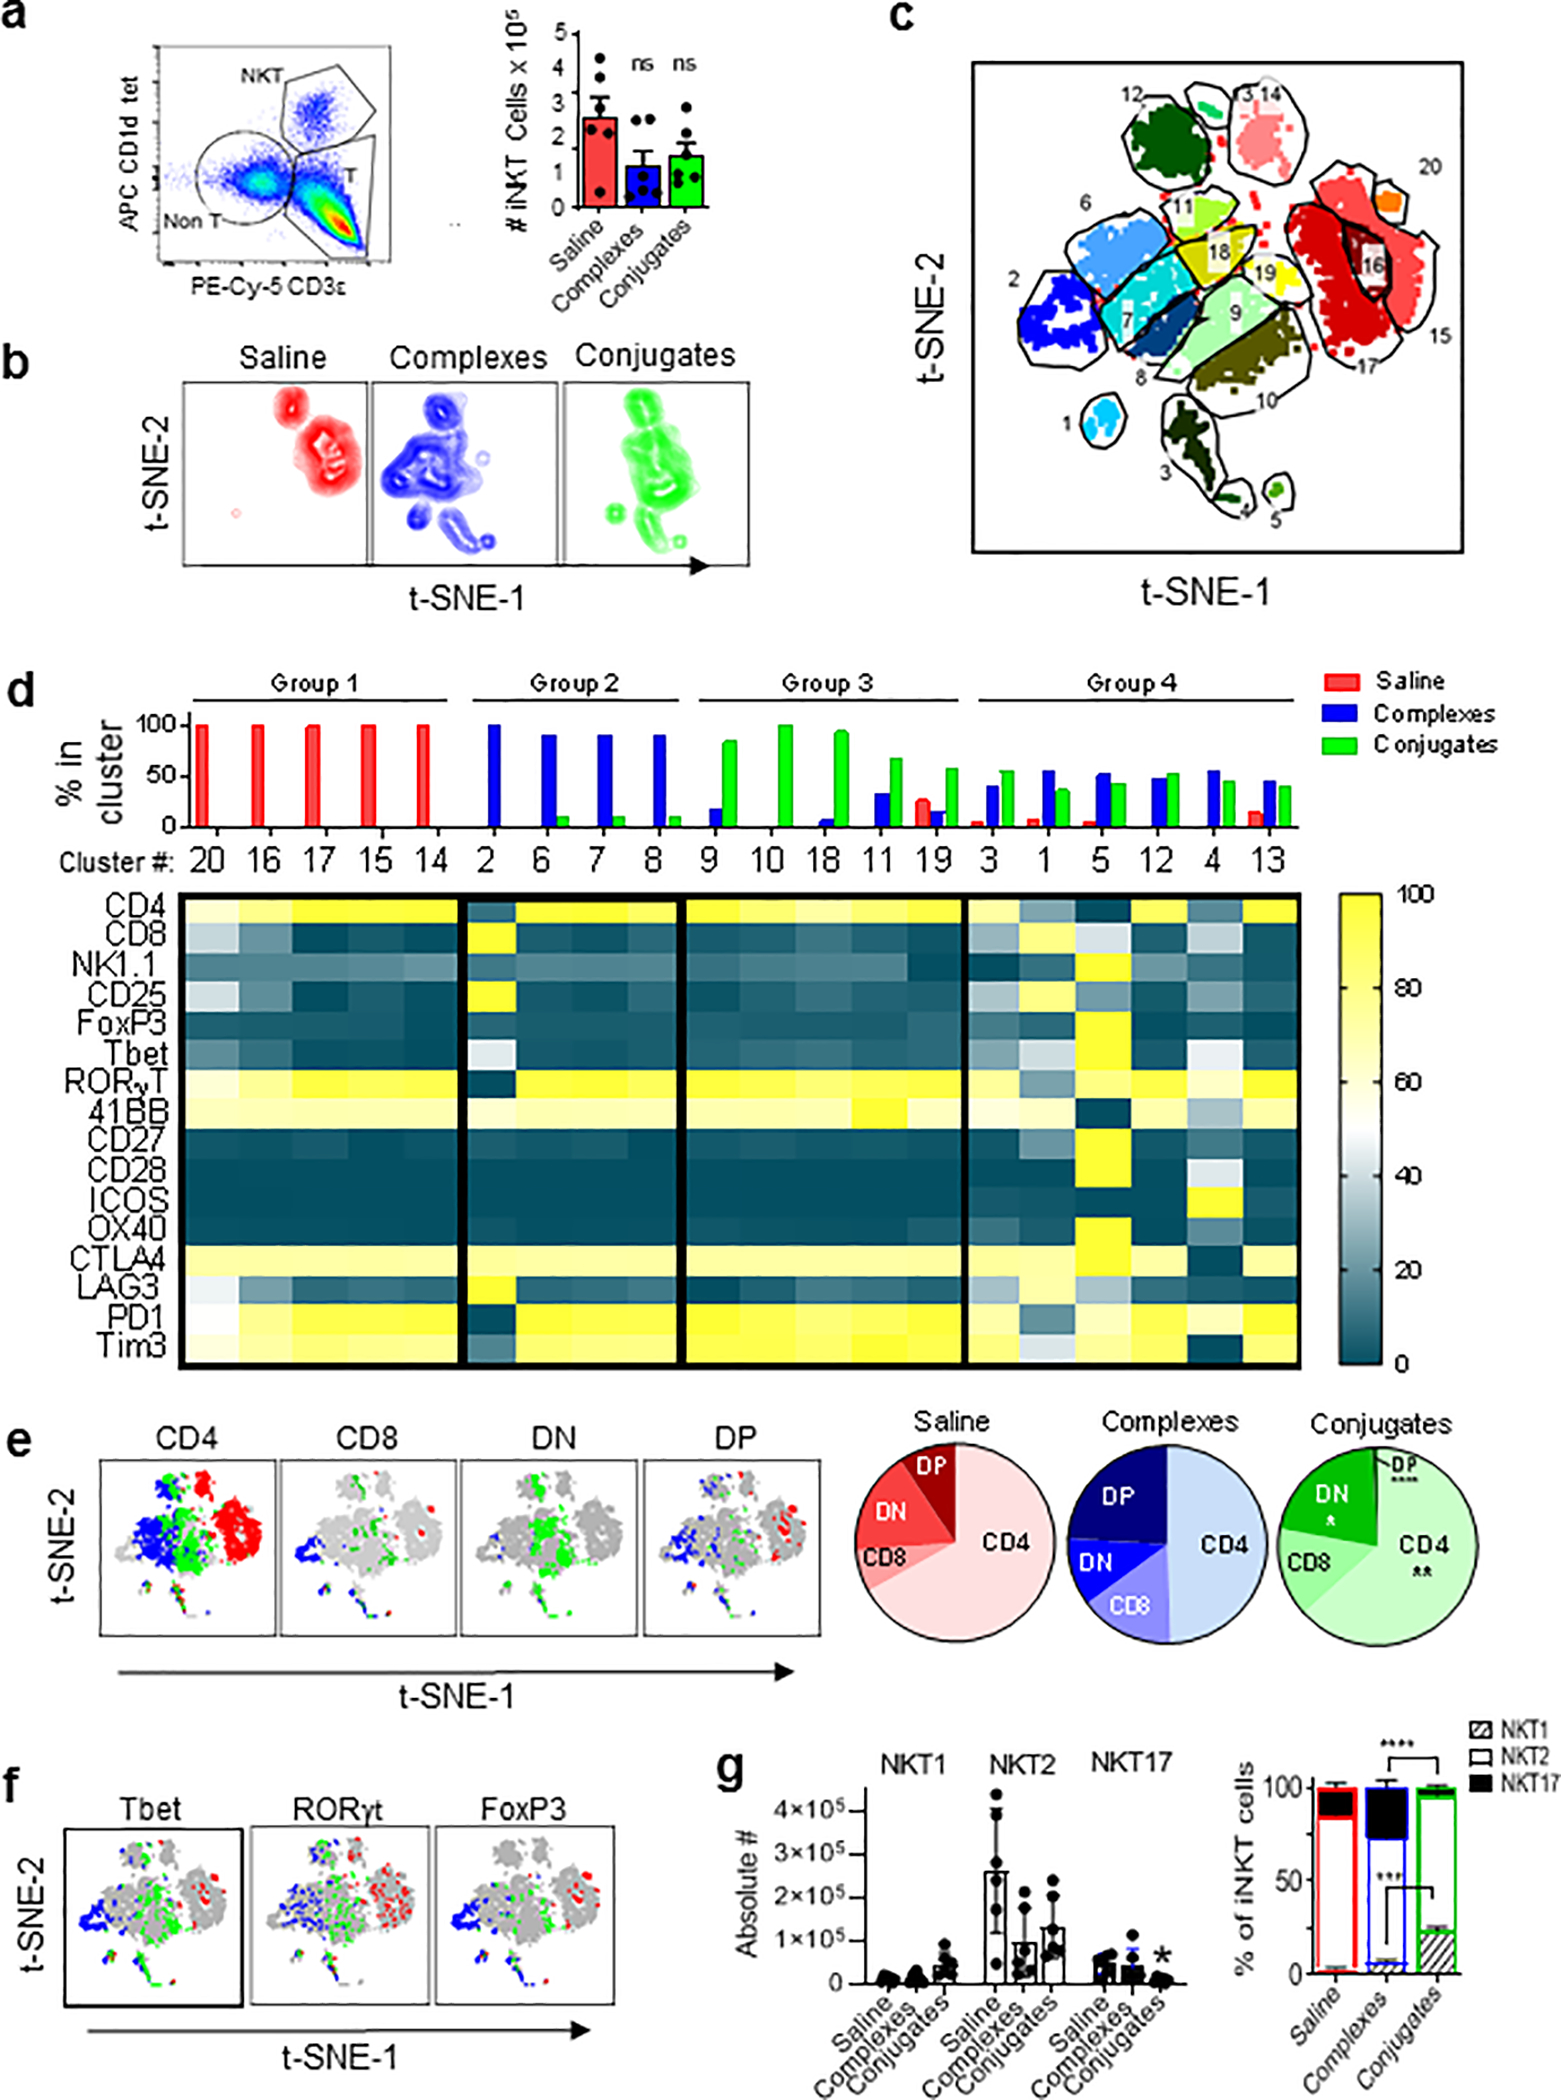
Figure 6; Analysis of iNKT cells in TILs.

(a) Gating of iNKT cells in TILs and quantitation of absolute numbers of iNKT cells in total TILs extracted per tumor from mice with MC38-huHER2 tumors and treatments as in Fig. 5 (ns, not significant; 2-way ANOVA). (b) Two dimensional plots from t-SNE analysis of tetramer+ iNKT cells in TILs based on expression of 16 markers (listed in panel d). (c) Concatenated t-SNE analysis for all three treatment groups identifying 20 phenotypic clusters of iNKT cells. (d) Identification of four distinct groups of iNKT cells in TILs based on clustering by t-SNE. Bar graph on top shows relative abundance for each cluster in TILs of each treatment group. Heat map shows level of expression (normalized MFI) for each marker analyzed. (e) Subsets of CD4 and CD8α single positive, double positive (DP) and double negative (DN) expressing iNKT cells from t-SNE analysis mapped onto the concatenated data set (grey) in colors corresponding to each treatment group (red for saline, blue for complexes and green for conjugates). Pie charts show relative proportions of each subset by treatment group. (f) Similar to panel E, except showing distribution of signature transcription factors for functional iNKT cell subsets (i.e., classified as NKT1, NKT2 or NKT17 based on Tbet and RORγt as previously described36). (g) Bar graph on left shows absolute numbers of iNKT cells in total TILs isolated per tumor. *P < 0.05 for NKT17 cells in conjugate group compared to saline controls. Other trends observed did not reach statistical significance. Stacked bar graph on right shows subsets as percentage of total iNKT cells. Means ± 1SE for treatment groups are shown. ***P < 0.01, ****P < 0.001; 2-way ANOVA with Sidak multiple comparison test. All analyses based on data from 6 mice per group
