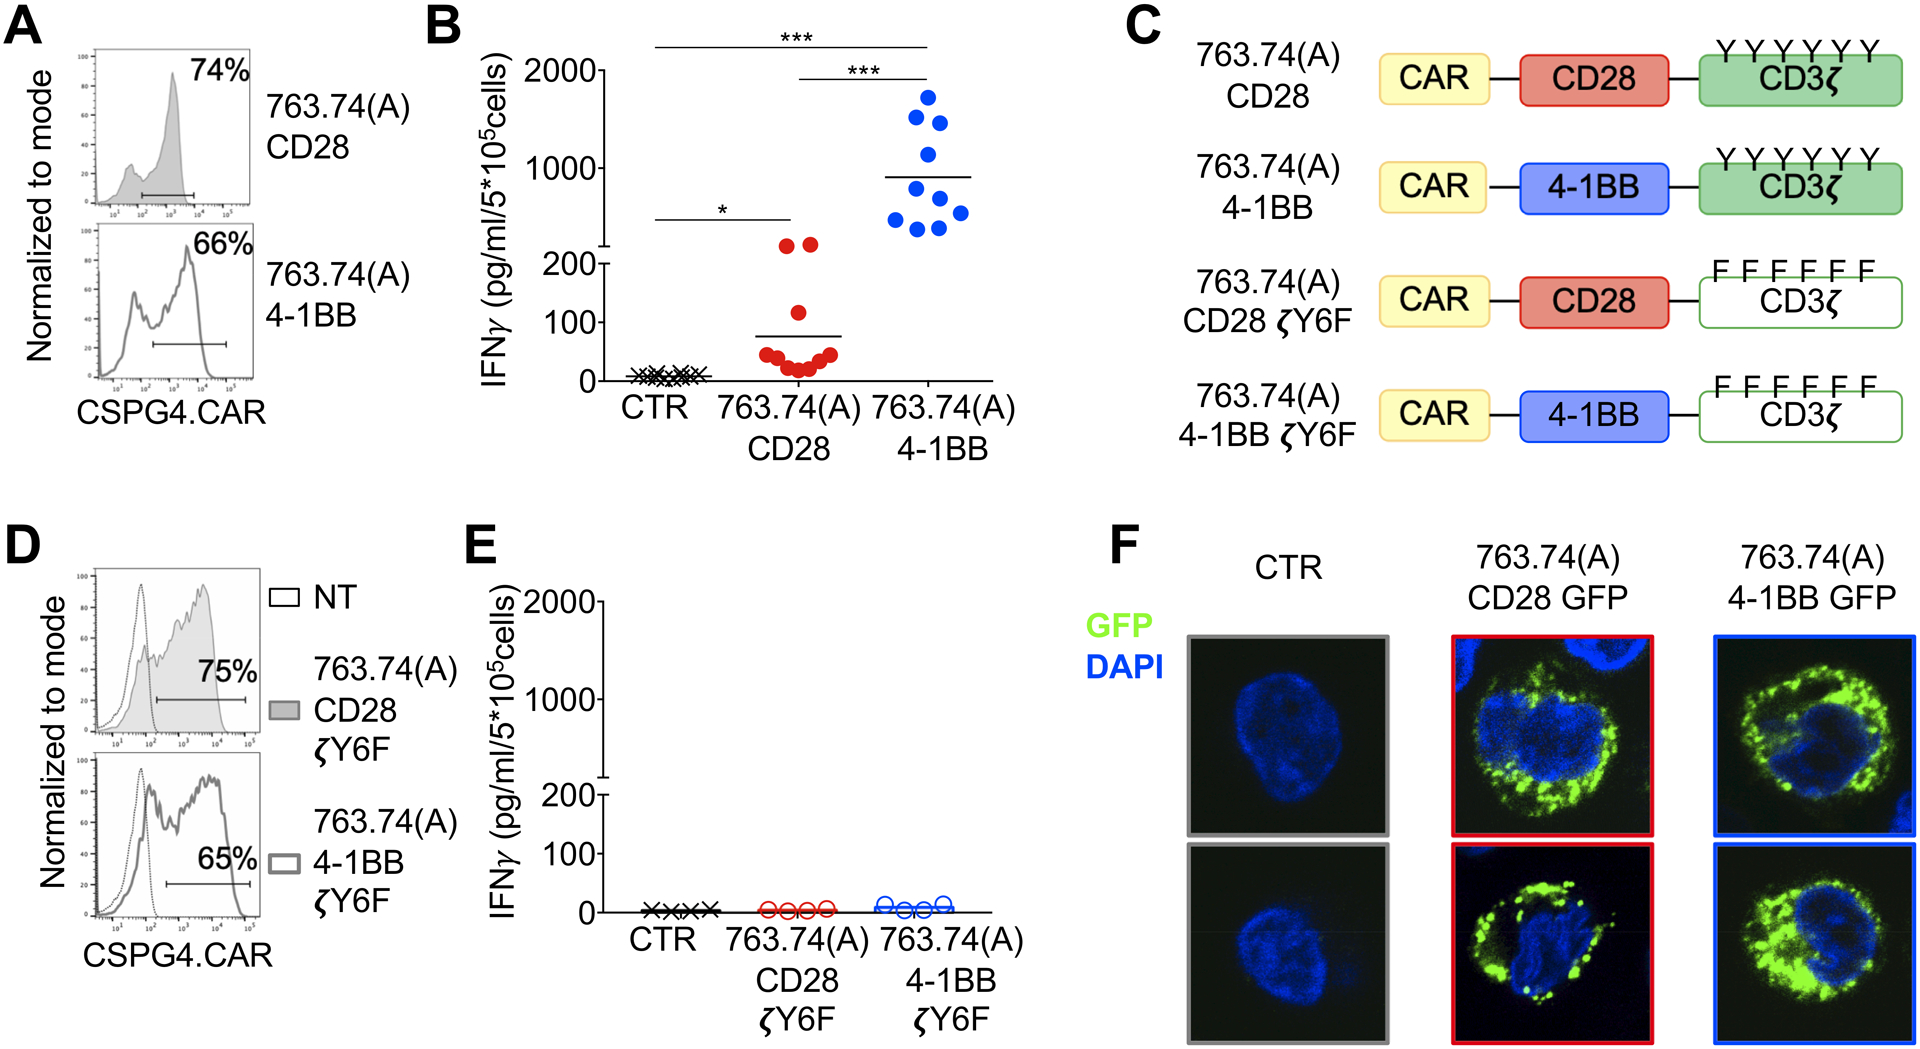
Figure 1. Tonic signaling of CAR-T cells expressing the CAR encoding scFv 763.74(A).

A. Representative flow cytometry plots showing CAR expression in T cells assessed at day 8 of culture. 763.74(A) CD28 and 763.74(A) 4–1BB indicate the specific CAR expressed in T cells. CAR expression was assessed using an anti-idyotipic antibody followed by the staining with a secondary rat anti-mouse antibody. B. Quantification of IFNγ released into supernatants by T cells expressing control CAR (CTR), 763.74(A) CD28, or 763.74(A) 4–1BB CAR without CAR-specific activation after 24 hours (n=10, mean shown). *P=0.0184; ***P=0.0003 (CTR vs. 763.74(A) CD28); ***P=0.0004 (763.74(A) CD28 vs. 763.74(A) 4–1BB), paired t-test. C. Schema of the 763.74(A) CAR constructs encoding either CD3ζ wild-type or CD3ζ in which all tyrosine amino acids of ITAMs have been mutated. D. Representative flow cytometry plots showing CAR expression in T cells assessed at day 8 of culture. 763.74(A) CD28 ζY6F and 763.74(A)4–1BB ζY6F indicate the specific CAR expressed in T cells. CAR expression was assessed using an anti-idyotipic antibody followed by the staining with a secondary rat anti-mouse antibody. Non-transduced (NT) T cells were a negative control. E. Quantification of IFNγ released into supernatants by T cells expressing control CAR (CTR), 763.74(A) CD28ζY6F or 763.74(A) 4–1BBζY6F CAR without CAR-specific activation after 24 hours (n=4, mean shown). F. Representative confocal microscopy imaging showing GFP aggregation in T cells expressing GFP-tagged CARs (green) in which the CARs are obtained using the scFv 763.74(A) and either CD28 or 4–1BB endodomains. CTR indicates control T cells. Blue staining indicates the DAPI. Shown are representative cell of a single field (Magnification 63X).
