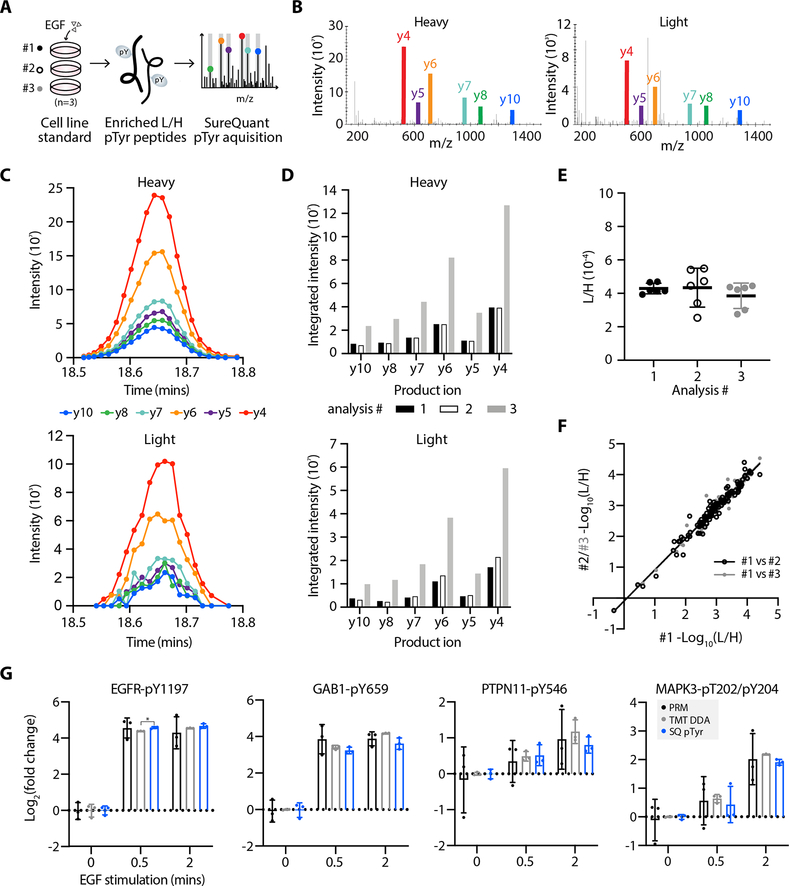
Figure 2.
High quantitative reproducibility is achieved with SureQuant pTyr. A, Experimental setup. IS-trigger peptides were added to three biological replicates of A549 cell lysate stimulated with epidermal growth factor (EGF). Enriched light (L) and heavy (H) pTyr peptides were analyzing using SureQuant pTyr acquisition. B, MS/MS spectra from analysis #3 of the heavy (left) and light (right) CTTND1 peptide, SLDNN[pY]STPNER-pY904, at peak intensity, where [pY] denotes the residue position with pTyr modification. Monitored product ions are uniquely colored and labeled with b/y ion. C, Ion intensity over time for the 6 heavy (upper) and light (lower) product ions from CTTND1 pY904 in analysis #3. Each MS/MS event is represented by a point. D, Integrated peak area intensities for each product ion in C. Bar color corresponds to analysis #. E, Ratios of light to heavy signal intensity (L/H) of CTTND1 pY904 for each analysis, where each point represents the L/H value of a single product ion. Solid line and error bars represent the mean and standard deviation, respectively. F, Correlation of (L/H) signals across 127 peptides between analysis #1 and #2 (r2=0.96, black) and analysis #1 and #3 (r2=0.97, grey). G, Log2 fold change values, relative to the mean peptide abundance at the 0-minute timepoint, of pTyr peptides for three data acquisition methods: PRM (black), TMT-labeled DDA (grey) and SureQuant pTyr (blue). Significant differences in quantitation between PRM and TMT-DDA vs. SQ pTyr are represented as *p<0.05 (Dunnett’s multiple comparisons test). Each sample includes n=3 biological replicates, error bars represent the standard deviation.

