Figure 5.
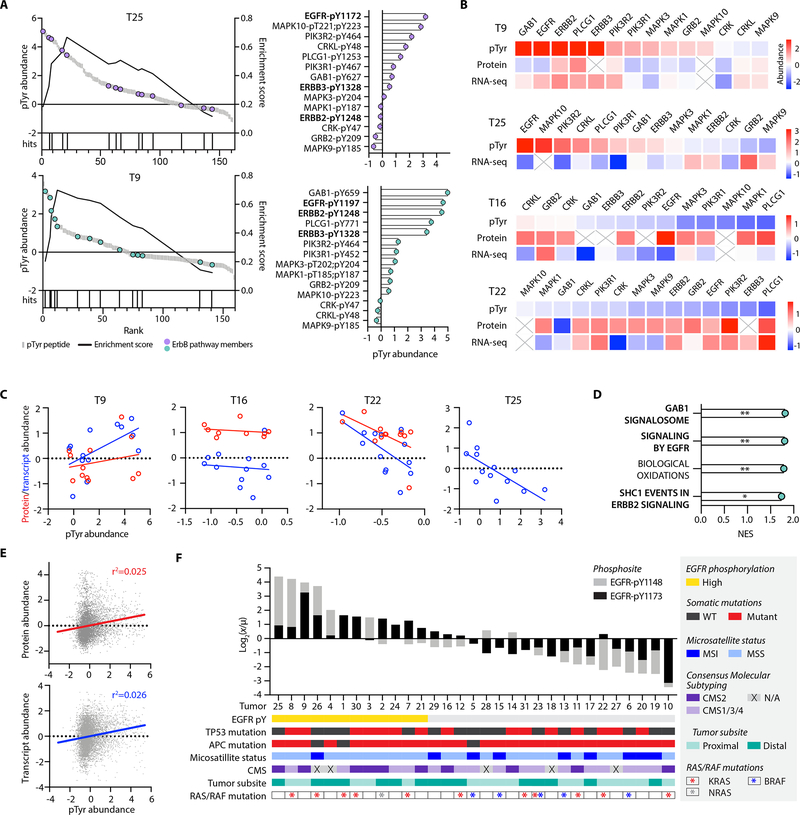
EGFR phosphorylation levels identify candidates for anti-EGFR therapy. A, Enrichment plots (left) of ErbB signaling pathway in T25 (purple) and T9 (teal). Peptide rank (x-axis) versus pTyr abundance is plotted on the left y-axis, and the running enrichment score is plotted on the right y-axis. Each hit signifies a pTyr source protein present in the ErbB signaling pathway library. All pTyr peptides identified in the ErbB signaling pathway and their corresponding pTyr abundance (right), with ErbB family receptors annotated in bold. pTyr abundance values are z-score normalized light to heavy signal ratios. B, Z-score normalized pTyr abundance (pTyr), protein expression (protein) and transcript expression (RNA-seq) levels of ErbB signaling pathway members. C, Correlation between pTyr abundance and protein (red) or transcript (blue) expression of ErbB signaling pathway members. Protein and transcript abundance values are z-score normalized. Correlation coefficients for pTyr vs. protein for T9, T16, and T22 are r2= 0.06, 0.05, 0.29, respectively. Correlation coefficients for pTyr vs. gene expression for T9, T16, T22, and T25 are r2= 0.35, 0.01, 0.38, and 0.43, respectively. Protein expression data for T25 was unavailable. D, Normalized enrichment score (NES) for positively enriched reactome pathways in T9 using RNA-seq data. *= p<0.05, **= p<0.01, FDR q-value < 0.05 for all. E, Correlation between all pTyr sites in the full matrix and corresponding protein expression (top, r2=0.025) and gene expression (bottom, r2=0.026) levels. All values are z-score normalized. F, Cumulative pTyr signal, calculated as the ratio of tumor light to heavy pTyr signal (x) to the mean light to heavy signal (μ) across tumors, log2 transformed for two EGFR phosphopeptides rank ordered from highest to lowest signal. Tumor specific annotations are indicated by color, and pY1148 and pY1173 denote the EGFR residue position with pTyr modification.

