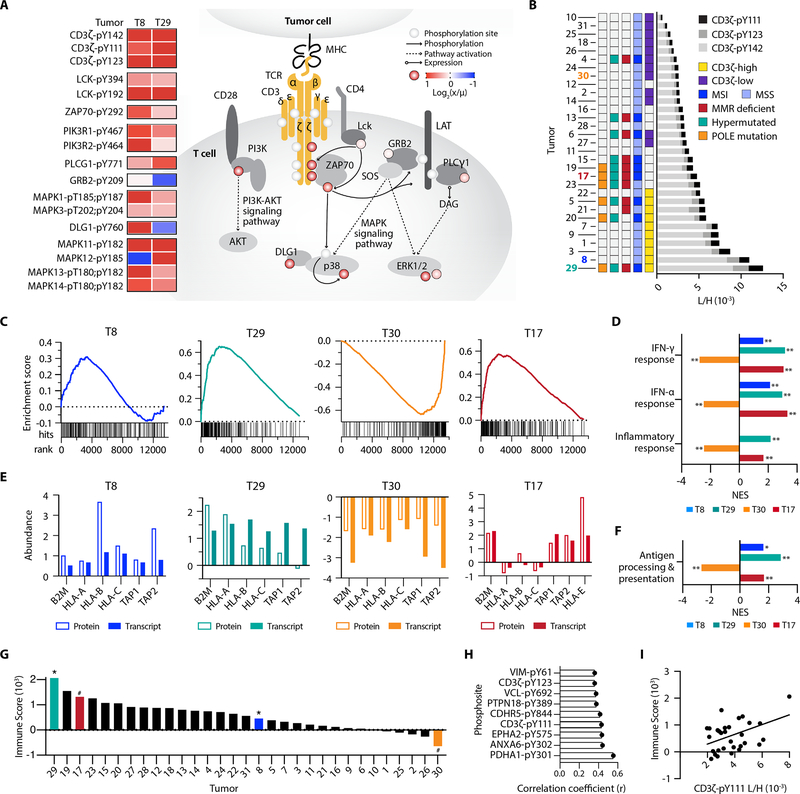
Figure 6.
pTyr signatures of T cell signaling pathway peptides. A, pTyr signal of T-cell signaling peptides, calculated as the ratio of tumor light to heavy pTyr signal (x) to the mean light to heavy signal (μ), for T8 and T9. Phosphorylation levels on the signaling diagram (colored circles) correspond to T8, and pY denotes the residue position with pTyr modification. B, Cumulative CD3ζ pTyr levels (light to heavy signal) from three CD3ζ pTyr peptides. Tumor-specific biomarker statuses are indicated by color. C, Gene set enrichment analysis (GSEA) plots for IFN-γ response, with gene rank (x-axis) versus running enrichment score (y-axis). Each hit signifies a gene present in the gene set. D, Normalized enrichment scores (NES) from GSEA for selected significantly enriched pathways *p<0.05, **p<0.01, q<0.25 for all. E, Z-scored normalized protein and transcript expression levels of antigen presentation genes. F, GSEA NES for antigen processing and presentation gene ontology gene set (GO:0019882), *p<0.05, **p<0.01, q<0.25 for all. G, Immune score of tumors from Vasaikar et al., * = positively enriched # = negatively enriched in pTyr T cell signaling peptides. H, Unique pTyr peptides with significant positive correlation to immune score (p < 0.05). I, Correlation between immune score and the L/H signal of CD3ζ-pY111, r2 = 0.19.

