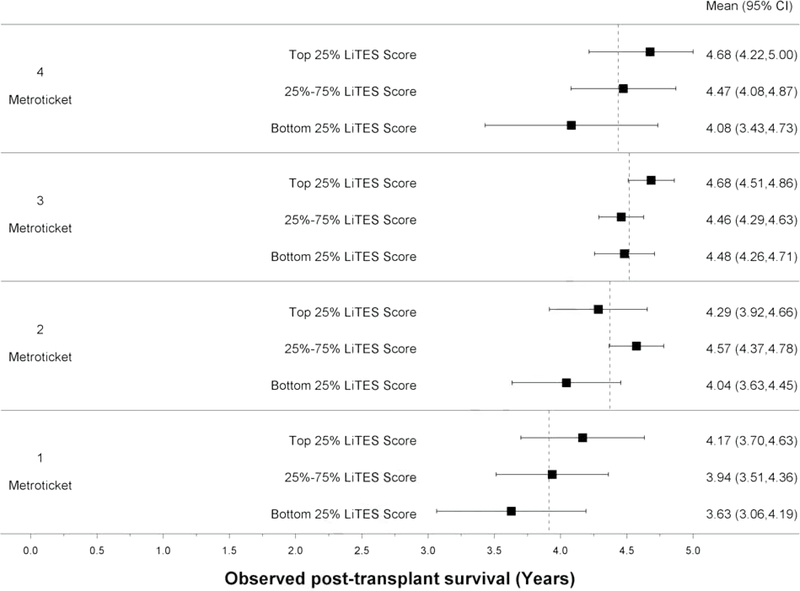
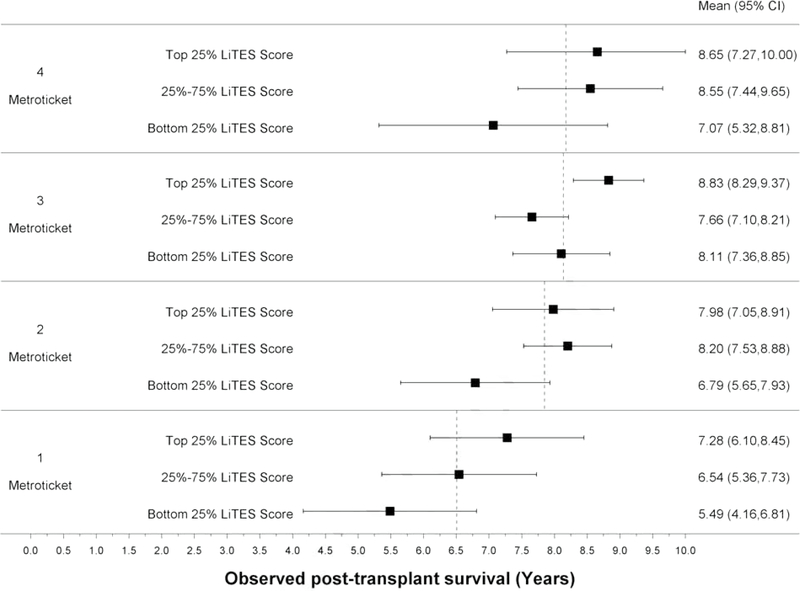
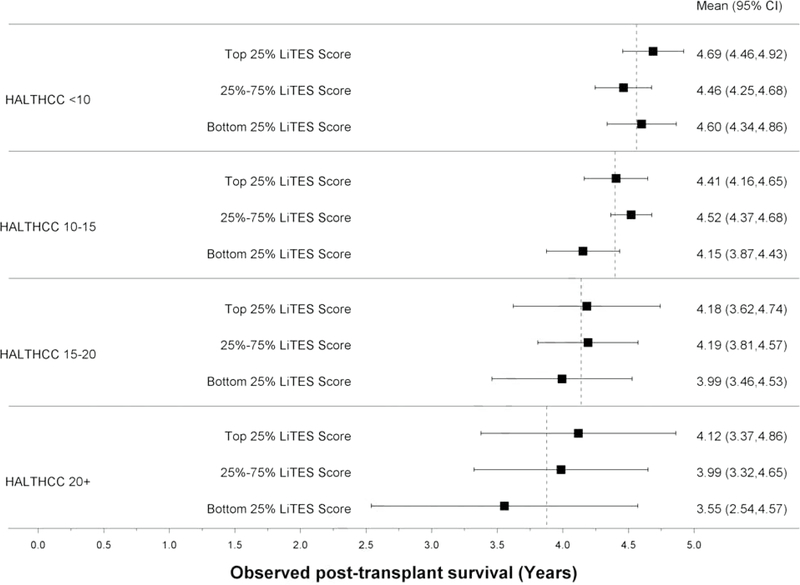
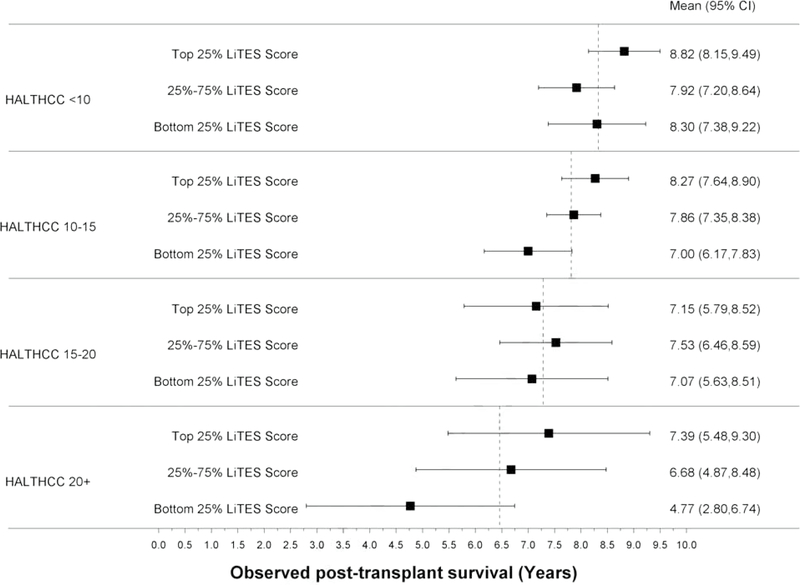
Figure 3 (four panels): Observed survival times within quartiles of Metroticket and HALT-HCC scores relative to LiTES-HCC score categories.
a. Figure 3a: Observed mean survival time and 95% CI over 5-year time horizon for continuous Metroticket
b. Figure 3b: Observed mean survival time and 95% CI over 10-year time horizon for continuous Metroticket
c. Figure 3c: Observed mean survival time and 95% CI over 5-year time horizon for continuous HALT-HCC
d. Figure 3d: Observed mean survival time and 95% CI over 10-year time horizon for continuous HALT-HCC


