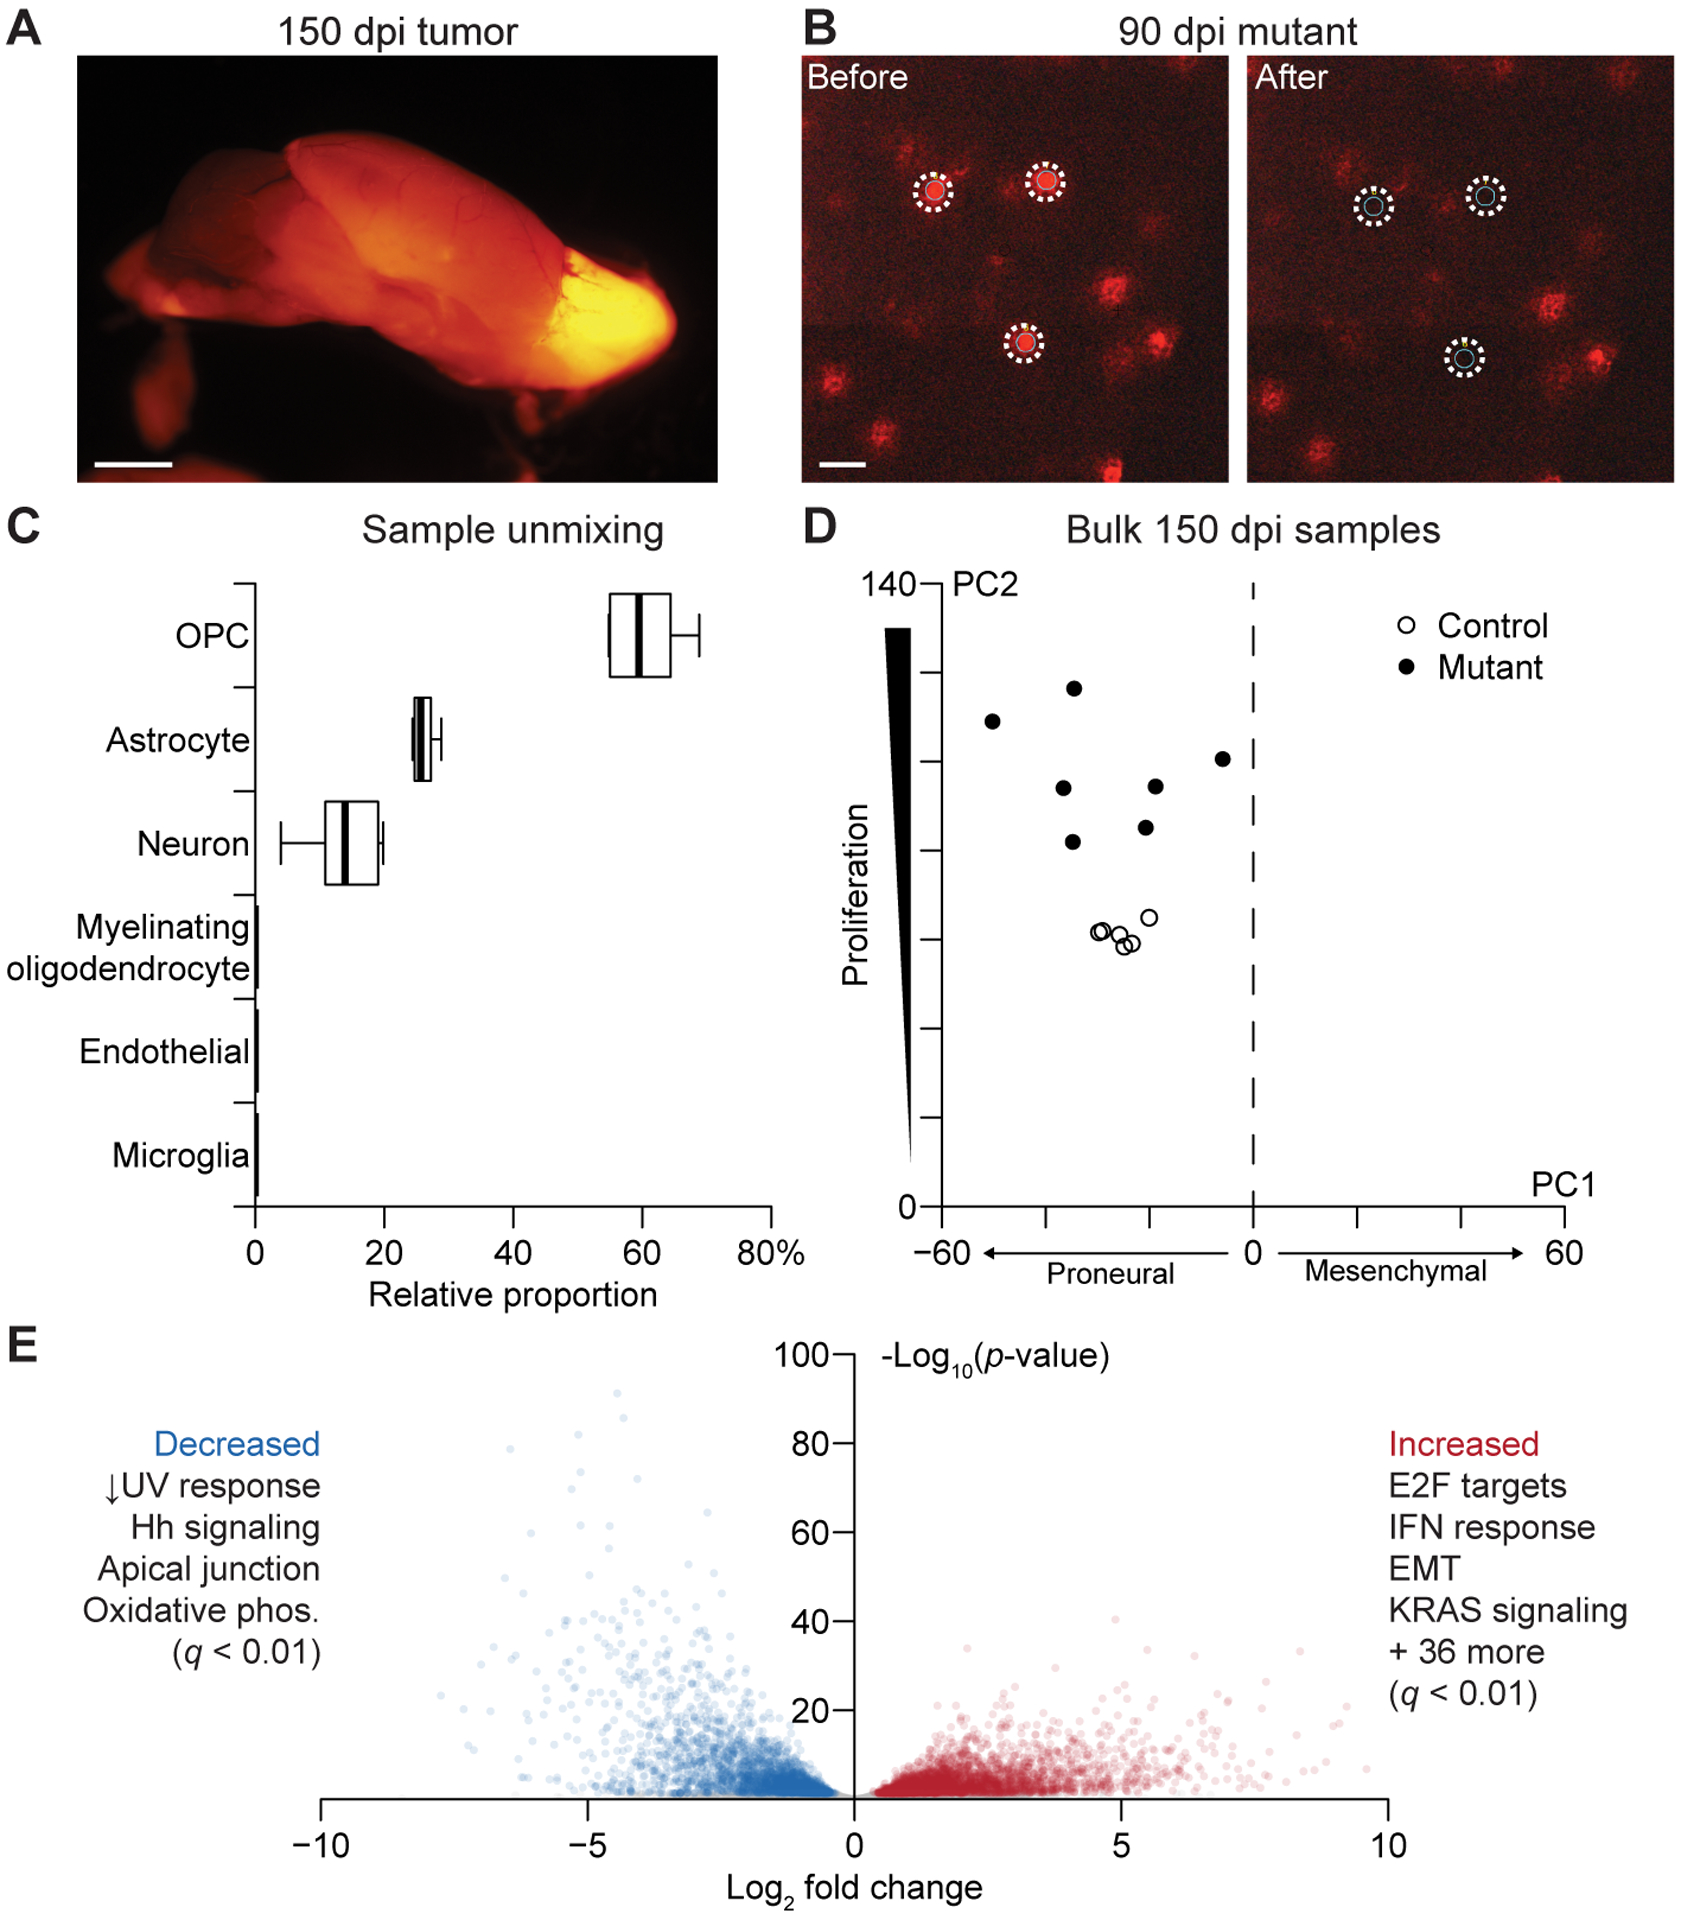
Figure 2.

Bulk LCM transcriptomes of labeled gliomas are specific to OPC-derived cells and show gene-expression changes consistent with Nf1–Trp53 deletion. A, Macroscopic image of a labeled glioma in the olfactory bulb of a 150 dpi animal. Scale bar is 2 mm. B, Microscopic image of 90 dpi mutant OPCs. Images were taken before and after LCM to show spatial fidelity of the isolation. Scale bar is 25 μm. C, Relative proportion of the indicated cell types in the control bulk RNA-seq samples estimated by CIBERSORT (24). Boxplots show the median and interquartile range with whiskers indicating the range from n = 6 independent samples of control 150 dpi OPCs. D, Projection of the bulk 150 dpi mutant and control samples onto principal components capturing proneural–mesenchymal state and relative proliferative status (3). E, Volcano plot of differentially expressed genes between tumors and controls. Enriched hallmark pathways among increased and decreased transcripts are summarized, and the complete list is available in Supplementary File S1.
