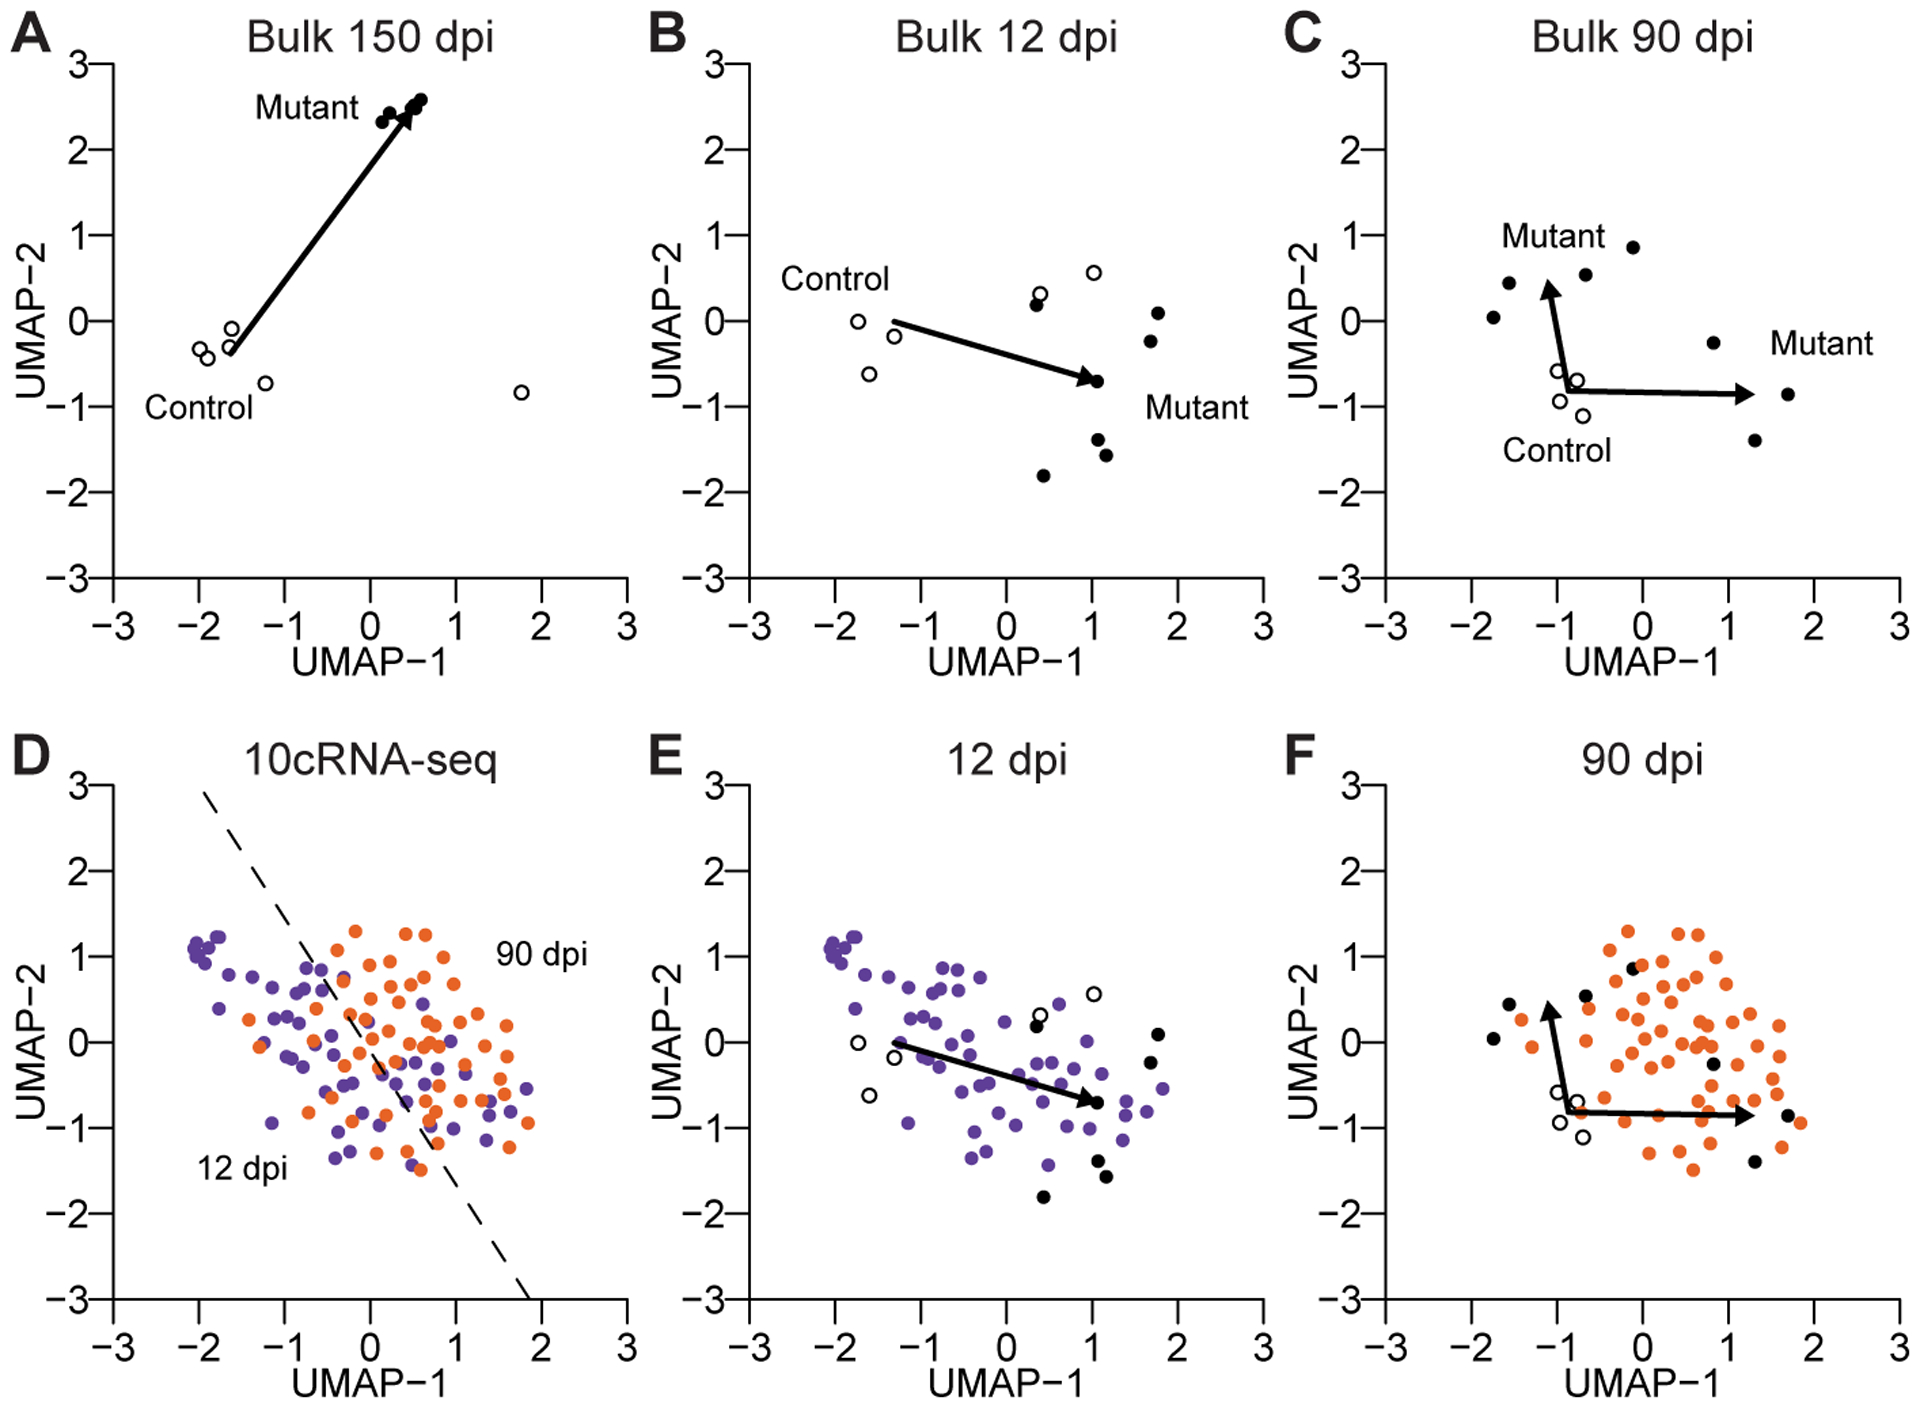
Figure 6.

An integrated map of mutant gliomagenesis at the bulk and subpopulation levels. A–C, UMAP visualization of control and mutant bulk samples at 150 dpi (A), 12 dpi (B), and 90 dpi (C). Arrows indicate the vector of the control median centroid to the mutant median centroid(s). Two mutant centroids (identified by k-means clustering with two groups) were used at 90 dpi. D–F, UMAP visualization of 10cRNA-seq data at 12 dpi (purple) and 90 dpi (orange). The 12 dpi–90 dpi-separating hyperplane (identified by a support vector machine) is shown in D. Bulk and 10cRNA-seq samples are replotted together at 12 dpi (E) and 90 dpi (F). A single UMAP was generated using all of the data in Fig. 6, with indicated data subsets shown in individual subpanels.
