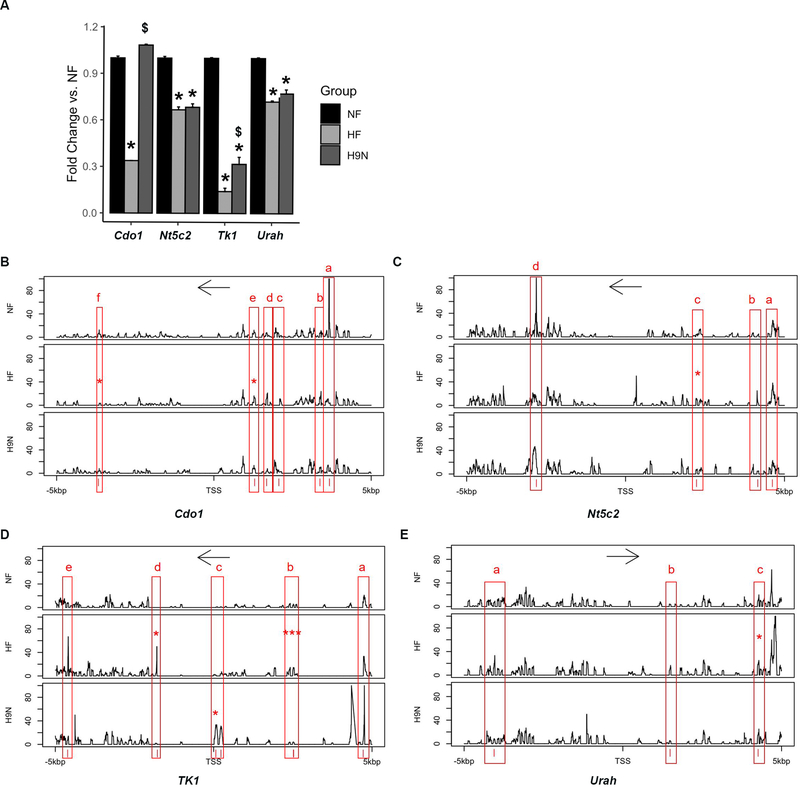
Figure 6. Genes involved in one-carbon metabolism, whose hepatic expression was associated with DNA modification, had altered expression in the HF offspring.
6A. Expression of Cdo1, Nt5c2, Tk1 and Urah in offspring livers was measured by realtime-PCR. Data are presented as the mean ± SE, n=5. * indicates P < 0.05 vs. NF group. # indicates P < 0.05 vs. the REF group. $ indicates P < 0.05 vs. the HF group. 6B-E. DNA methylation pattern of a 10 kbp genomic region extending from 5 kbp upstream of the TSS to 5 kbp downstream of the TSS was analyzed by next generation sequencing. The y-axis indicates % of methylation at each DNA nucleotide. Only those DNA methylation changes more than 20% were considered potential methylation pattern changes. The x-axis indicates the location of each DNA nucleotide around the TSS. * indicates P<0.05 and *** indicates P<0.001 vs. NF group.

