
Figure 3.
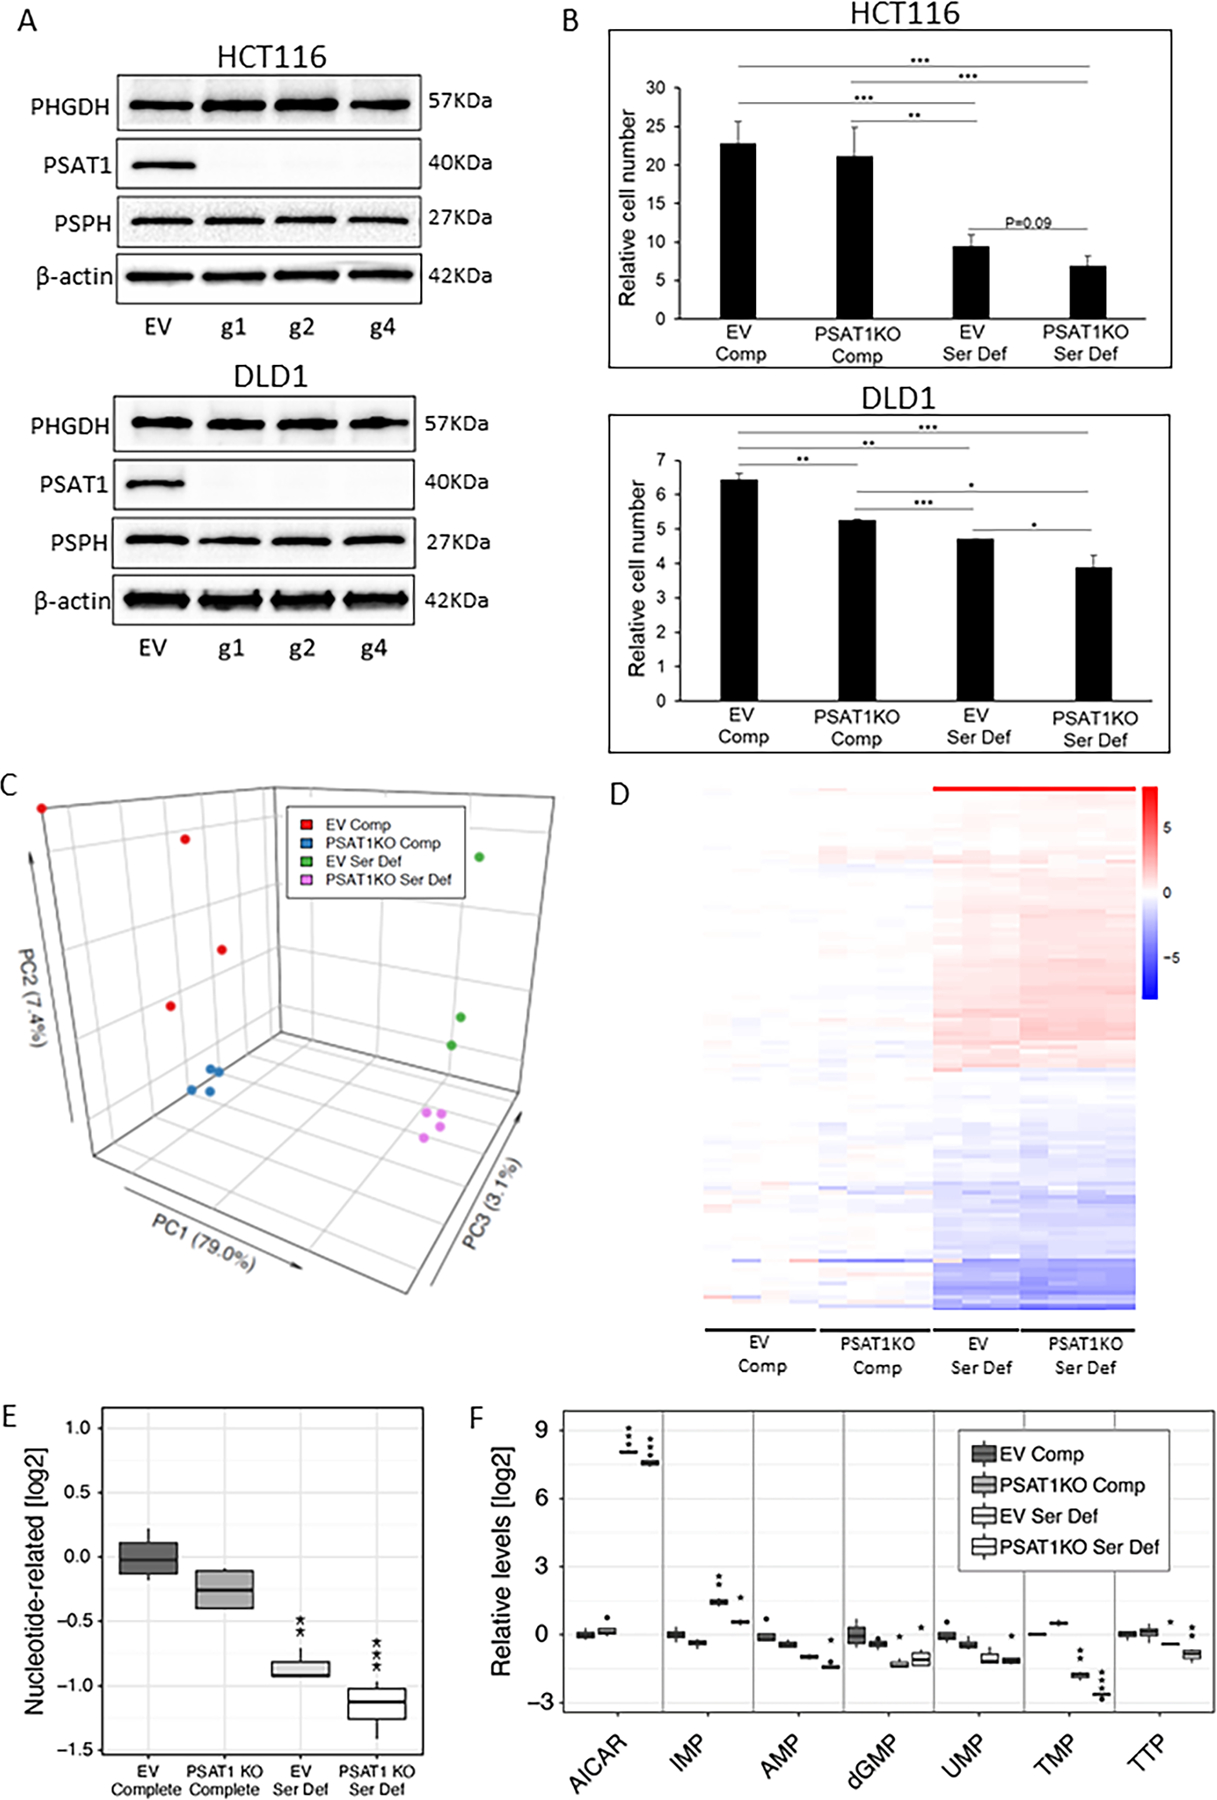
Restriction of exogenous and endogenous sources of serine maximally suppresses colon cancer cell proliferation and alters metabolism. (A) Western blotting of PHGDH, PSAT1 and PSPH following CRISPR-based deletion of PSAT1 in HCT116 and DLD1 human colon cancer cells containing Cas9, using 3 different guide RNAs. EV = empty vector. (B) Cell number was quantified by flow cytometry-based counting following 4 days of culture and calculated as relative cell number compared to day 0 in HCT116 and DLD1 EV and PSAT1KO cells (containing g4) cultured in Complete (Comp) or Serine Deficient (Ser Def) media. n=3 samples per group. Data represent the means ± S.D. *P<0.05; **P<0.01; ***P<0.001 as indicated. (C-F) EV and PSAT1KO HCT116 cells were cultured in Comp or Ser Def media for 12 hr and the abundance of intracellular metabolites was determined. (C) Principal component analysis of metabolic changes across all samples are shown. (D) Metabolites that were significantly changed after multiple testing correction (FDR<0.05) in either PSAT1KO Comp, EV Ser Def or PSAT1KO Ser Def HCT116 cells compared to EV Comp cells are shown as a heat map. Scale = log2 fold change compared to EV Comp group. (E) Results of aggregation-based analysis of metabolite profiling showing the direction of change in the nucleotide category. Data represent log2 fold change compared to EV Comp cells. **P<0.01; ***P<0.001. (F) log2 fold change of significantly altered metabolites in the nucleotide category compared to EV Comp cells are shown. *FDR<0.05; **FDR<0.01; ***FDR<0.001. n=3–4 samples per group. AICAR=5-Aminoimidazole-4-carboxamide riboside; IMP=Inosine monophosphate; AMP=Adenosine monophosphate; dGMP=2’-deoxyguanosine 5’-monophosphate; UMP=Uridine 5’-monophosphate; TMP=Thymidine monophosphate; TTP=Thymidine 5-triphosphate.